
Containerships: Activity between China and the US looks optimistic, with cargo miles surpassing 2019 levels
Unsurprisingly, trades between China and the US faltered at the beginning of the Covid-19 pandemic back in February 2020, but a clear recovery has since been made on the popular container route. Container journeys so far this year between China and the US have totalled over 500, 10% more than during the same period in 2019, suggesting that despite Covid-19, the route has still seen growth. The majority of these journeys went to US West Coast ports, such as Long Beach and Los Angeles, starting in container hubs such as Yantian, Ningbo and Shanghai.
This article will focus on cargo miles and how trends in capacity have changed between China and the US throughout this year and last, alongside looking at how the number of inactive containerships has evolved. It will also highlight how changes in vessel speed can help construct a picture of demand and economic activity across the container sector.
China to US Cargo Miles
This chart shows a year on year comparison of daily containership cargo miles between China and the US.
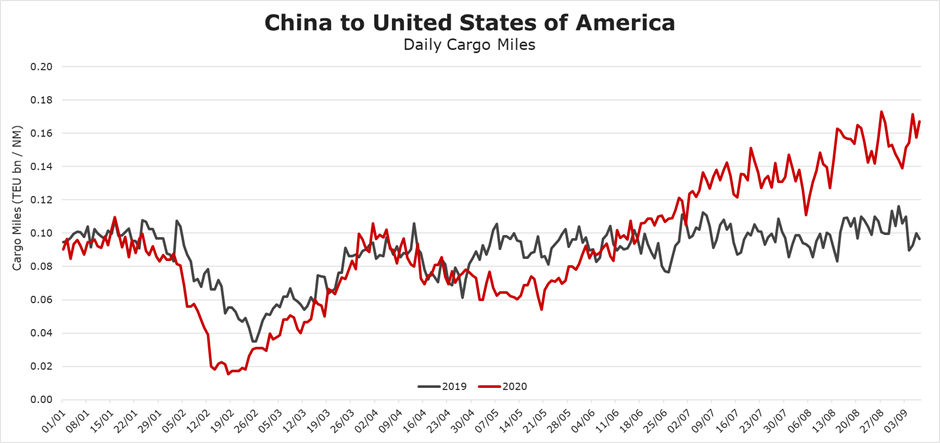
China to US trades declined more prominently than usual at the start of 2020, due to Chinese New Year and pronounced by the impacts of Covid-19. As China made progress to contain the virus, in April, cargo miles recovered and started to follow a similar pattern to last year. Demand declined shortly after this however, as throughout May, cargo miles were lower than levels seen at the same time last year. This decline correlated with the increase in Covid-19 cases in the US, as the impacts of the virus were felt later in the West and demand for goods lessened due to lockdowns.
However, as countries put measures in place to safely receive cargo and ports began to clear, things took a positive turn at the start of June, as cargo miles between China and the US began to improve. By early September, daily cargo miles reached 0.16 TEU bn/NM per day, compared to summer 2019 when they stabilised at around 0.10 TEU bn/NM.
China to US Cargo Capacity
The below chart shows a weekly TEU volume between China and the US since January 2019.
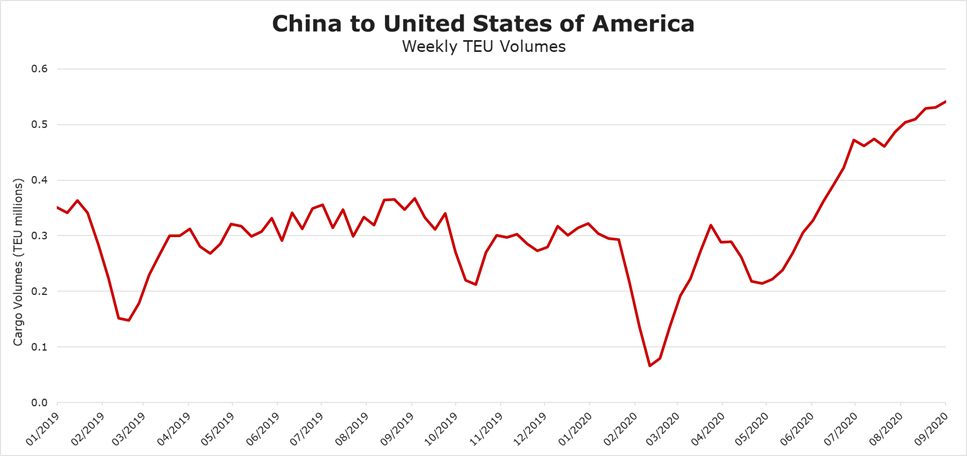
A similar trend as seen with cargo miles can be seen above, with an initial recovery in April as China began to ramp up production and exports again, followed by a reduction in May as US demand diminished. However, since June, an influx in weekly TEU volumes has been a very positive sign for the Container sector, as it suggests demand has been improving almost consistently for 3 months. Countries globally are having to learn to adapt to everyday lifestyle changes because of Covid-19 and as a result, online shopping demand is also growing. The US is no exception, as consumers have been avoiding shops and spending online instead, benefitting the Container industry and contributing towards improvements in cargo miles and capacity.
Interestingly, the number of inactive Containerships globally seen over the past year has reached two notable peaks, shown on the graph below.
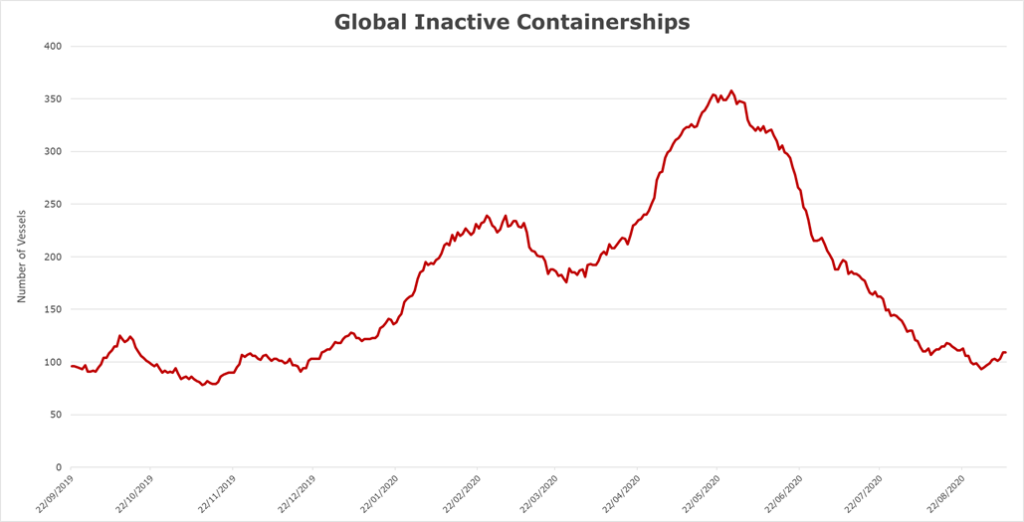
The first around February, correlating with the drop seen in both cargo miles and volumes between China and the US, as expected. The second, however, shows that the count of inactive Containerships was even higher at the start of June, at c.350 vessels. Therefore, despite high levels of idle vessels seen globally, cargo volumes continued to grow between the two countries. Since June, however, we have seen a reduction in the number of inactive Containerships and numbers have now stabilised in line with figures seen this time last year.
Are Containership earnings still showing signs of improvement?
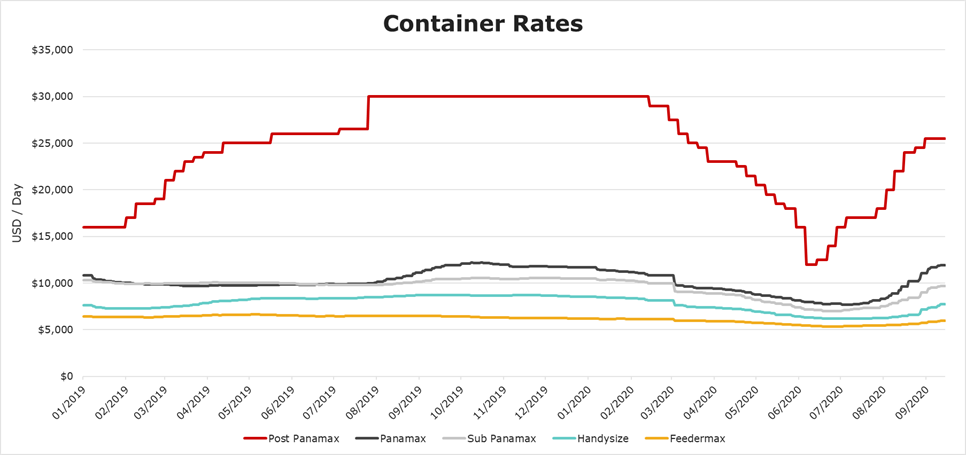
As we see signs of global economic activity improving, charter rates across the Container sector as a whole are looking strong, seen to now be reaching close to pre Covid-19 levels. Rates have been improving since July this year, with some Container types such as Panamax, already surpassing rates seen this time last year, reaching over $11,500 at the start of September. However, there is the possibility that these rates could change after the usual summer rates peak, and if Covid-19 cases rise into the colder, European winter months.
Speeds
Looking at average vessel speeds can be another useful indicator of demand, as deceases in average speeds suggest vessels slow steaming, port delays and a weakening in demand. The below chart shows average speeds for both New Panamax and Post Panamax vessels, both of which commonly engage in transatlantic and transpacific routes.
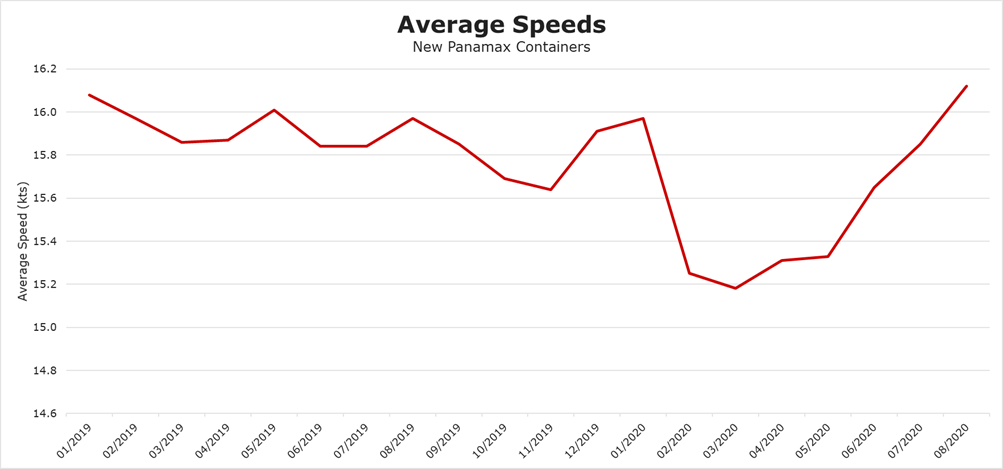
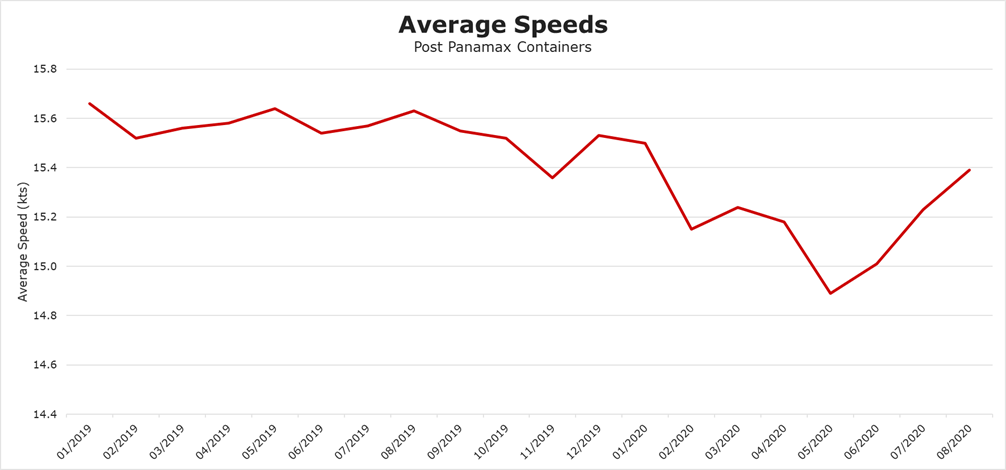
It is clear that for both Container sub-sectors, speeds fell in February this year, dropping by nearly 5% between January and March for New Panamax. Operational delays and a record number of blank sailings in the container sector were contributing factors to these speed decreases. However, since May, Container speeds overall have been increasing and showing no signs of slowing down, suggesting that bookings are rising and demand for vessels has improved.
Summary
Despite the struggles faced by the Container sector this year, the China to US route has displayed impressive growth overall since initial declines at the start of this year. Both cargo miles and cargo capacity have increased on the route since May, which correlates with when speeds began to pick up again. Increases in speed across all container types is a very positive sign, as it suggests that Containerships are becoming more active. Containership newbuild orders are also currently at all-time lows, where orders are down c.60% YTD 2020 compared to YTD 2019. Therefore, excess vessel capacity will be kept low, another contributing factor to keeping demand strong.
The pandemic has caused a shift in the way people shop, with purchases from physical stores declining massively and a large proportion of goods being ordered online. Manufacturing hubs across Asia are exporting these goods which are going towards satisfying US import requirements. However, the China to US route still has the potential for volatility going forward, possibly threatened by wider geopolitical trade tensions between the two countries and the uncertainty regarding the Covid-19 situation.
Disclaimer: The purpose of this blog is to provide general information and not to provide advice or guidance in relation to particular circumstances. Readers should not make decisions in reliance on any statement or opinion contained in this blog.
Want to know more about how our
data can help you assess the market?
Comments
Leave a Comment