Sowing the Seeds of a Food Crisis
Introduction
The economic environment for global trade has profoundly shifted in the past year. Recovering demand from the pandemic has collided with supply side constraints in many industries, inflation and interest rates are rising, and the Ukraine war, together with sanctions on Russia have disrupted global commodity flows. Amid the myriad uncertainties, perhaps the most troubling is this: what will be the impact on global food supplies and which countries will be most affected? Russia and Ukraine are two of the world’s “Big Eight” exporters of grain, along with the USA, Canada, Brazil, Argentina, the EU, and Australia. The world can scarcely afford to lose them from global food trade.
War broke out at the end of February 2022. Ukrainian ports closed and leading grain traders such as ADM and Bunge suspended operations. Meanwhile, international sanctions on Russia severely restrict credit availability for grain trading. Using our Trade data, Figure 1 below shows the top twenty destinations for Russian and Ukrainian grain cargoes in the 01 March to 31 May period over the last two years, and the varying declines in volumes to those destinations in the same period this year.
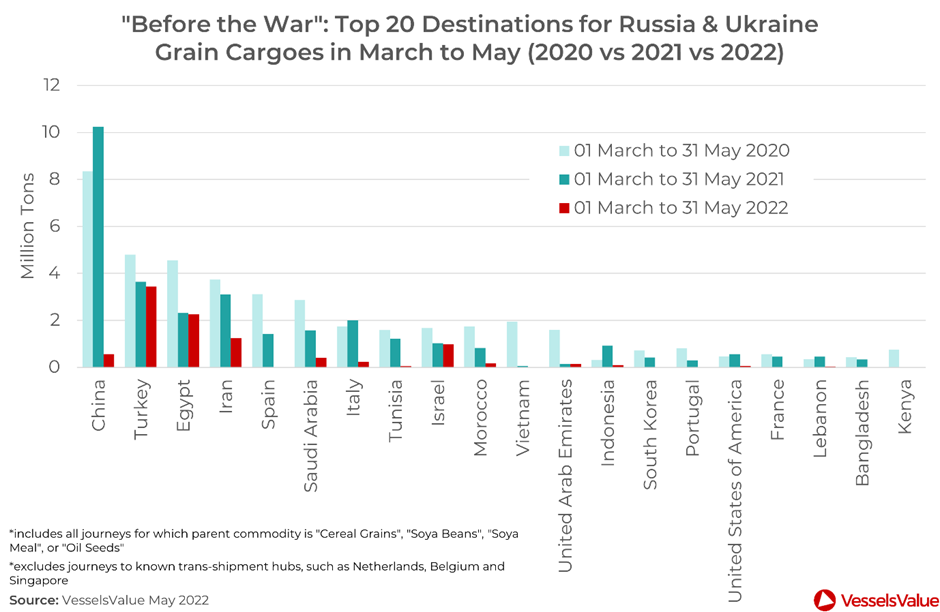
Several notable features stand out from Figure 1. China is by far the biggest destination for Russian and Ukrainian grain in recent years, taking between eight and ten million tons in the time period, but volumes have collapsed since the war. The next six destinations usually receive between two and five million tons. While some, such as Spain and Italy, also exhibit a collapse since the war, others such as Turkey and Egypt have maintained volumes very close to the same period last year. For context, the UN Food and Agriculture Organization estimates some 25 million tons of grains are currently stuck in Ukraine.
China’s Grain Supplies are Diversified and Secure
Though China is the biggest destination for Russian and Ukrainian grain, it is not a cause for concern. Using our Trade data, Figure 2 below shows China’s seaborne import volumes from the two countries in the context of its imports from the other six countries that comprise the “Big Eight”. In the two years before the war, Russia and Ukraine only accounted for 10% of China’s total seaborne imports. Other big exporters, particularly USA and Brazil, are much more prominent and are relatively secure suppliers.
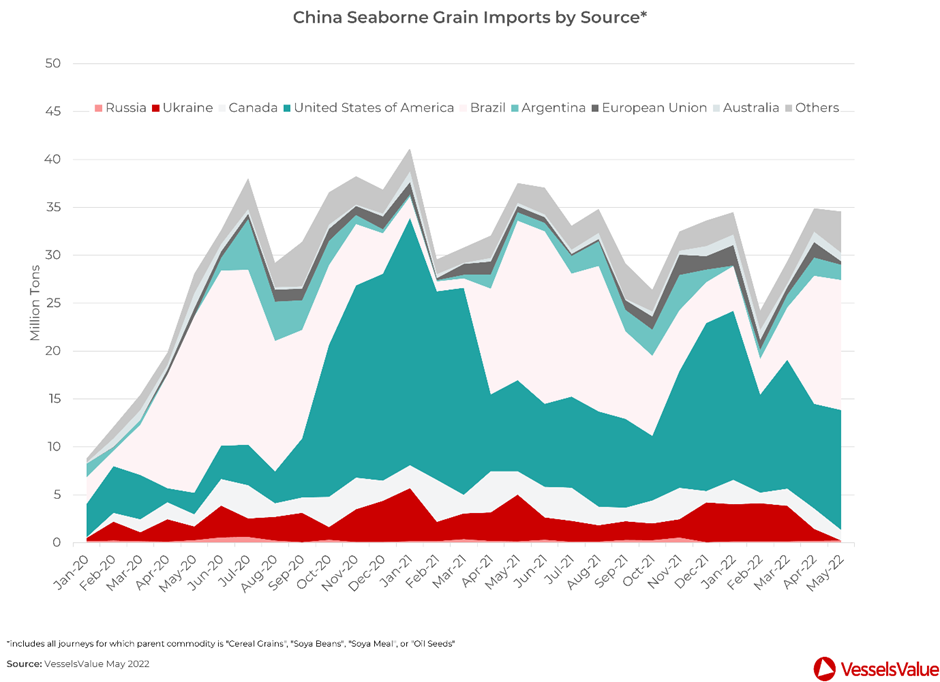
Figure 2 demonstrates that, if a country is a major importer of Russian and Ukrainian grain, it is not necessarily a catastrophe, if sources of supplies are diversified. Figure 2 also illustrates the difference in seasonality between Northern Hemisphere and Southern Hemisphere grain seasons. This can clearly be seen in the shifting dominance between USA and Brazil in China’s supply mix. It serves as a reminder that, for those countries that are vulnerable to steep declines in Russian and Ukrainian volumes, the impact will not be fully apparent until Northern Hemisphere grain season, later this year.
Using Our Trade Data to Examine All Angles of Vulnerability
If China, despite being the major destination for Russian and Ukrainian grain and exhibiting a steep decline in this year’s volumes, remains diversified and secure, one must look further down the list of top destinations to identify where any shortages may arise. Our Trade data shows, for each country in the list of top twenty destinations for Russian and Ukrainian grain, the percentage of total seaborne grain imports accounted for by the two countries in the year leading up to the war, in Figure 3 below.
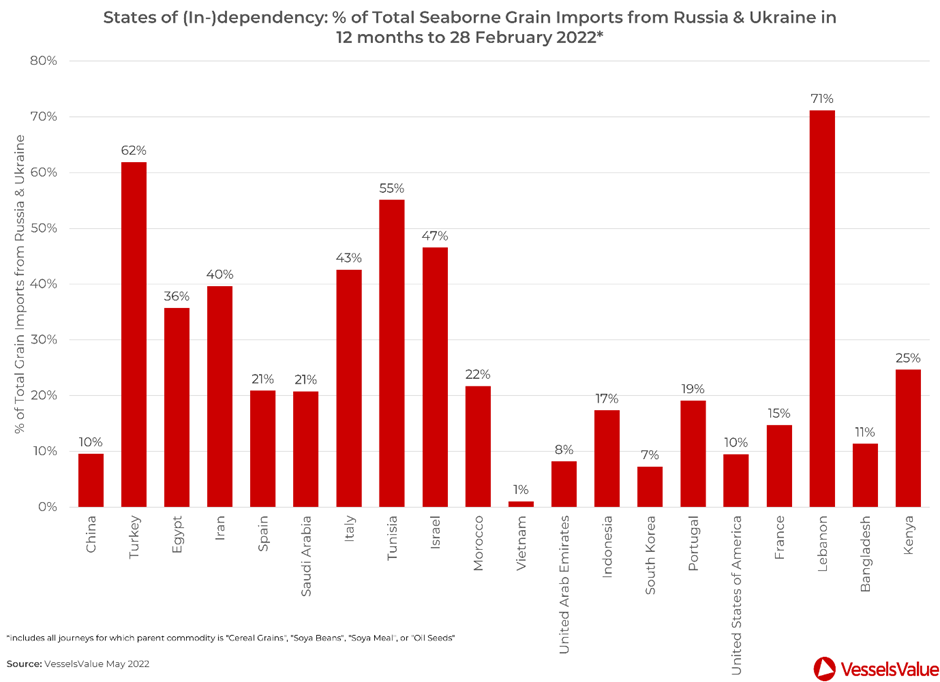
Several countries in the Eastern Mediterranean region, such as Turkey, Egypt, and Israel exhibit relatively high dependencies on Russian and Ukrainian grain. But, as our data shows in Figure 1 they have maintained volumes close to last year’s levels, so there is no immediate risk. Similarly, other big destinations such as Spain, Saudi Arabia and Morocco have seen volumes from Russia and Ukraine collapse, but these only comprised around a fifth of their total imports, so while worrying, it may not be a catastrophe.
Conversely, Lebanon stands out as country of particular concern. As our data shows in Figure 3, 71% of its seaborne grain imports came from Russia and Ukraine in the year before the war. Figure 1 shows trade flows have almost completely stopped on this route. Similarly, Tunisia imported 55% of its seaborne grain from the two countries in the year before the war, but almost nothing since. Meanwhile, Iran and Italy are of medium concern, although the former is additionally complicated by its own sanctions and UN aid program.
A Pinch of Salt with Assurances on Grain
Russian news agency Interfax reports Moscow is willing to lift the blockade on grain shipments from Ukraine in return for concessions on international financial sanctions. The Russian Defence Ministry states that demining and demilitarisation of the commercial seaport of Mariupol has been completed and the port will likely resume normal operations soon. However, it is unclear how it plans to ensure the usual functioning of the port, given navigation remains suspended in the Sea of Azov and logistical infrastructure in and around the city is completely devastated.
World trade in any major commodity is complex and multi faceted. Grain is no exception. Attempting to assess how the war plays out for global food markets requires not just an analysis of the top destinations, but also their imports dependencies, early indications of volumes since the war started, and each countries’ own circumstances, all with our Trade data. If food shortages emerge later this year, Lebanon and Tunisia may be worst affected.
VesselsValue data as of June 2022.
Disclaimer: The purpose of this blog is to provide general information and not to provide advice or guidance in relation to particular circumstances. Readers should not make decisions in reliance on any statement or opinion contained in this blog.
Want to know more about how our
data can help you assess the market?
Comments
Leave a Comment