
2022 Cargo Review: S&P and Values
Introduction
After 2021’s high S&P activity levels, 2022 was a more muted year. 2021 saw Bulkers and Containers take the spotlight, while 2022 had been the year of the Tanker. All sectors have appreciated in value, particularly for older tonnage where 20 year old vessels have increased in value by as much as c.142% in the Aframax sector. This was driven by the sanctions against Russia, with additional tonne mile demand stemming from the conflict and overall improved demand fundamentals globally.
This report will provide a breakdown of the S&P market for each asset and detail some of the factors that contributed to the trends that we have seen in 2022.
Tankers
Tanker Values
If 2021 was the year for Bulkers and Containers, 2022 was certainly the year of the Tanker. The Tanker market has been the talk of the town over the last 12 months, in stark contrast to the doldrums of 2021.
Due to the Russia Ukraine conflict, we have seen an improvement in the supply and demand fundamentals, earnings have firmed which has resulted in a significant firming to values. Russian sanctions, oil price caps and increased demand have all impacted Tanker trade flow patterns. In turn, these have had a positive impact on tonne mile demand and resulted in volatile but firm earnings, particularly across the crude market.
This is a result of various factors, including a number of vessels being sold out of the market and into the ‘dark fleet’. These sales take advantage of the premiums available from sanctioned cargoes, as well as changes to Tanker trade flow patterns that have had a positive impact on tonne mile demand.
Outlined below, the Matrix table shows the % change in the Market Values between 1st January 2022 and 31st December 2022.
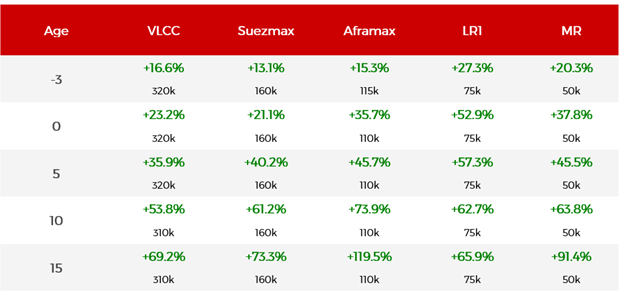
Tanker values have firmed over the course of the year across all sub sector and age categories. Older tonnage has seen the most impressive gains in values, and Aframaxes have been the strongest performers overall with prices for 15 year old vessels rising by almost 120% YoY, from USD 17.89 mil in January 2022 to USD 39.27 mil. This surge in prices has been driven by increased demand for vintage Tankers, which have entered the ‘dark fleet’ to trade on sanctioned Russian oil trade routes and transport sanctioned cargoes.
Since the Russian oil sanctions came into place in December, we have seen significant premiums being warranted for Ice Class fitted Suezmax and Aframax vessels. These vessels make up a small percentage of the fleet and are desirable for owners to trade in the Northern Hemisphere throughout the winter season.
Values for 15 year old MRs rose by c.91% YoY from USD 12.11 mil to USD 23.18 mil. Over the course of 2022, values for older MRs skyrocketed to the highest levels since 2008. Freight rates for MRs were firm but volatile throughout the year, peaking at 74,983 USD/Day in December on the MR Atlantic Basket (TC2 & TC14).
This gave rise to speculation that the clean market will now follow the same pattern as the crude market, due to the sanctions on the import and transportation of Russian petroleum products that came into force on 5th February 2023.
Tanker S&P

2022 saw an overall increase in Tanker secondhand sales with transactions up by c.30% YoY. A total of 851 Tankers changed hands, compared to 656 in 2021. Of this figure, Handy Tankers accounted for the majority of sales, accounting for almost half of Tanker sales at c.42%, followed by Aframaxes, the workhorse of the crude fleet, totalling c.23% of sales. Suezmaxes ranked third with c. 13%.
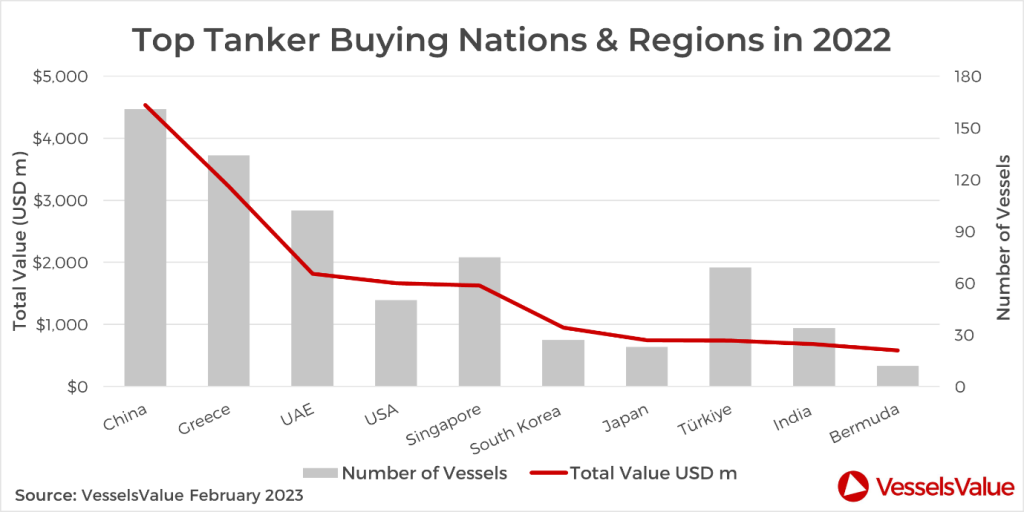
Chinese demand for Tankers topped the charts during 2022, particularly in the first half of the year with a total sales value of c.USD 4.5 bn, which equates to c.27%, and a total of 161 purchases. Greece ranked second in terms of value, with a total spend of c.USD 3.2 bn which equates to c.19% and 134 vessels bought. Although the sales above represent known buying countries, there has been an increase in the number of vessels sold with undisclosed buyers.
This comes with a trend towards older Crude Tankers, as more vessels enter into the “dark fleet” in order to capitalise on the premiums resulting from Russian trades. By the second half of the year, the purchasing market changed with many unknown buyers entering into the market, with a number of unknown UAE transactions reported. There were 48 Crude Tanker sales reported to undisclosed buyers over the course of 2022, compared to just 13 in 2021 and 19 in 2020. The average age of the vessels sold was 17 years, with the majority of sales in the VLCC sector, accounting for c.42%.
New market player Gatik Ship Management, an Indian Tanker operator that was founded in 2022 entered the market, buying 31 Tankers with a market value of USD 968.96 mil. Purchases covered both Crude and Clean sectors with an average age of 16 years, largely in the Aframax sector which accounted for over half of all transactions.
Notable sales include:
- VLCC Seaking (318,700 DWT, Feb 2005, Hyundai Heavy Ind) sold to undisclosed buyers for USD 51.50 mil (Scrubber fitted), VV Value USD 49.11 mil
- Suezmax Ridgebury Mary Jane (150,000 DWT, May 2008, Universal) sold to undisclosed buyers for USD 39.50 mil (SS/DD Due), VV Value USD 38.91 mil
- Suezmax Kriti Breeze (151,800 DWT, Nov 2003, Hyundai Heavy Ind) sold for USD 19.12 mil, VV value USD 28.09 mil
- Aframax Houston Star (116,100 DWT, Jul 2007, Universal) sold to undisclosed buyers for USD 39.25 mil (SS/DD Passed), VV Value USD 39.49 mil
- LR2 Saint George (109,400 DWT, Jun 2002, Dalian New Yard) sold to undisclosed buyers for USD 22.50 mil (SS/DD Passed), VV Value USD 26.99 mil
- MR1 (Chem / Product) Cape Bradley and Cape Bacton (40,200 DWT, Feb 2004, Apr 2004, Hyundai Mipo) sold En Bloc to unknown German buyers for USD 30 mil (DD Passed), VV Value USD 31.30 mil
Bulkers
Bulker Values
2022 saw a more moderate freight market for Bulkers. Despite a strong Q2, where the smaller sizes often outperformed their larger counterparts, Bulker earnings went on to correct downwards, leading to a softening of values throughout the year across all sub sectors and age categories.
Values have been negatively impacted by a much weaker market for Bulkers than what was seen in 2021. This is because demand for Dry Bulk commodities has been negatively impacted by slow world economic growth, easing port congestion and weak demand in China. Chinas strict Covid-19 policies led to a slow down and pressure on their economic growth. This, alongside a deepening property crisis, has created challenges for the global economy and Dry Bulk.
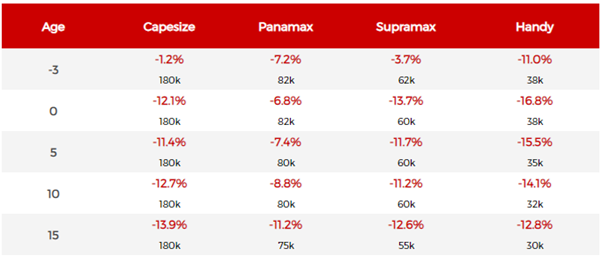
During Q2 2022, Capesize values for five year old vessels of 180,000 DWT spiked to the highest levels since 2010, peaking at c.USD 53 mil. However, over the rest of 2022 values took a tumble and fell to c.USD 40.5 mil by the end of December 2022. The softening trend was also particularly acute for modern tonnage in the Supramax and Handysize sectors, where values fell by as much as 15.5% throughout the year. Handysize values for five year old vessels of 35,000 DWT fell from USD 24.74 mil in January 2022 to USD 20.9 mil at the end of December.
Outlined below, the Matrix table shows the % change in the Market Values between 1st of January 2022 and 31st of December 2022.
Bulker S&P
In 2022 we saw a total of 1,041 Bulkers change hands, a decrease of c.21% compared to 2021. Of this total, c.31% of sales were in the Handy Bulker sector. Although values for this sector fell over the course of the year, prices remain at very high levels thanks to a firm freight market, where rates often surpassed those of much larger vessel sub sectors throughout the year. For example, in spring of 2022, Supramax and Handysize sectors were earning c.30,000 USD/Day on the spot market, whereas rates for their larger counterparts were circulating around the 20,000 USD/Day mark.
Handysizes were the most liquid on the S&P market last year, due to their versatility in being able to carry a wide variety of cargoes in a large range of ports. This is in contrast to the Capesize sector that is almost entirely dependent on iron ore demand, as Handysizes are able to withstand any volatility in individual commodities. Handysizes made similar earnings to Capesizes in 2022, and as the more cost effective of the Bulker types, they are a popular choice for new entrants into the market.
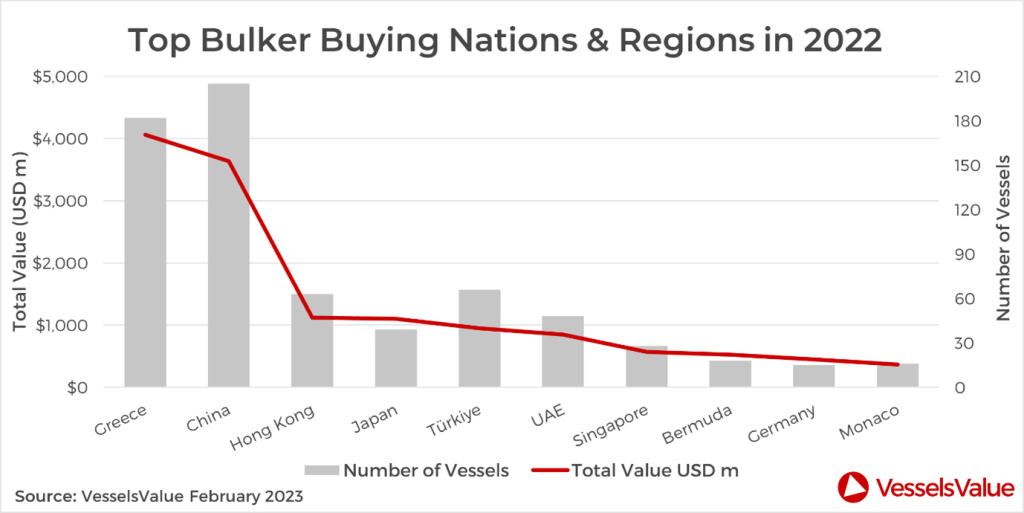
Greek demand for Bulkers was particularly strong for 2022, with a total of c.USD 4.1 bn spent on the acquisition of around 182 vessels. Greek buyers made up for c.30% of the total spent on Bulkers in 2022 and were closely followed by China who made up c.27% of the total, with c.USD 3.6 bn spent. However, China surpassed Greece in terms of units with 205 Bulkers bought.
Notable sales include:
- Capesize BC Lowlands Sunrise (181,500 DWT, June 2011, Koyo Dock) sold to Brave Maritime Corporation for USD 23.8 mil, VV Value USD 25.79 mil
- Panamax BC Nord Pollux (81,800 DWT, Jan 2016, Tsuneishi Cebu) sold to European buyers for USD 25.00 mil, VV Value 26.26 mil
- Ultramax BC Stony Stream (64,000 DWT, Apr 2015, Chengxi Shipyard) sold to US Buyer for USD 24.5 mil, VV Value USD 26.8 mil
- Handy BC Gant Grace (28,400 DWT, Jan 2010, Imabari) sold to Greek Buyers for USD 12.5 mil, VV Value 11.89 mil
Containers
Container Values
2022 was a volatile year for the Container market. Following on from a buoyant 2021, in the first half of 2022, Container earnings continued to gain ground to reach historical highs and by the end of March. Additionally, 1 year time charter rates for Post Panamax vessels were achieving a record breaking 148,500 USD/Day, an increase of 213% YoY. In the second half of 2022, rates were beginning to correct and by October, rates had fallen below the 100,000 USD/Day threshold, closing the year at a still relatively firm 62,250 USD/Day. This comes as concerns over the global economy put pressure on demand, which has led to reduced demand across the Container sector, along with easing port congestion across Chinese and American ports, consequently softening charter rates.
Container values had risen steadily over the last two years
until mid 2022, but following the pattern of earnings, values also saw a change
in trajectory. Over the course of the year, values for Containerships fell
across most sectors and age ranges. For example, the price of a five year old
Post Panamax vessel of 7,000 TEU fell by 46.9% from USD 122.73 mil in January
to USD 65.18 mil end of December. Values during 2022 peaked in May to USD
160.17 mil. The last time we saw such a drastic change to the market was during
the 2008/2009 financial crisis. At the time, values for five year old Post
Panamax vessels decreased from the peak of USD 144.17 mil in February 2008 to
USD 40.84 mil in July 2009, when values bottomed out at a drop of 71.7% in 17 months.
We are unsure when this rapid decline will finish, however, if it is anything
like the last crash, the end may be in sight.
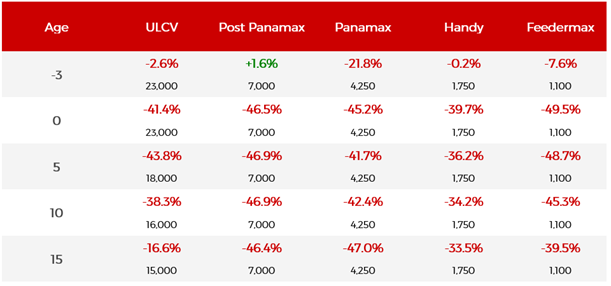
Outlined below, the Matrix table shows the % change in the Market Values between the 1st January 2022 and the 31st December 2022.
Container S&P
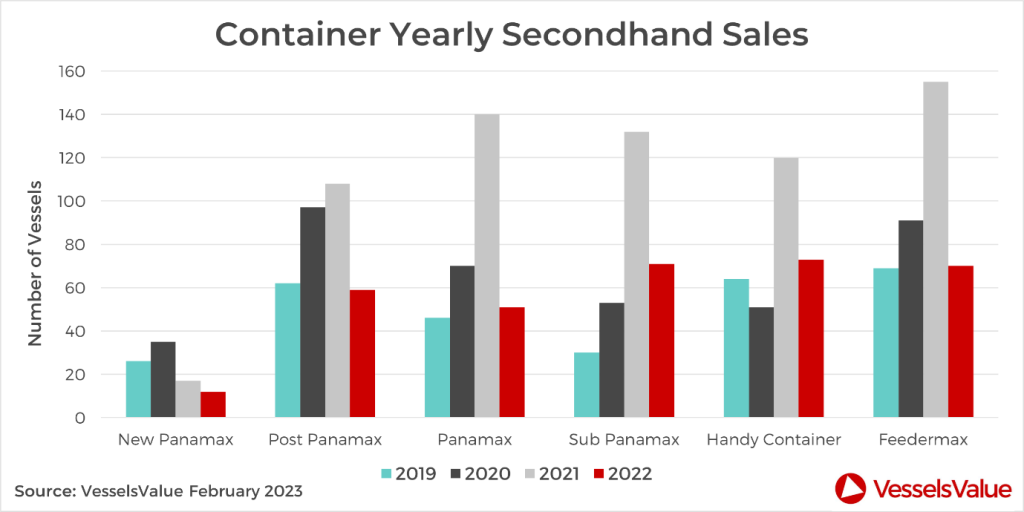
Overall secondhand sale and purchase transactions for Containerships halved in 2022, with 336 deals reported compared to 672 in 2021. The Panamax sector saw the largest declines, with sales figures down by c.64% YoY from 140 in 2021 to 51 in 2022. This is followed by the Feedermax sector, which was down by c.55% YoY from 155 to 70.
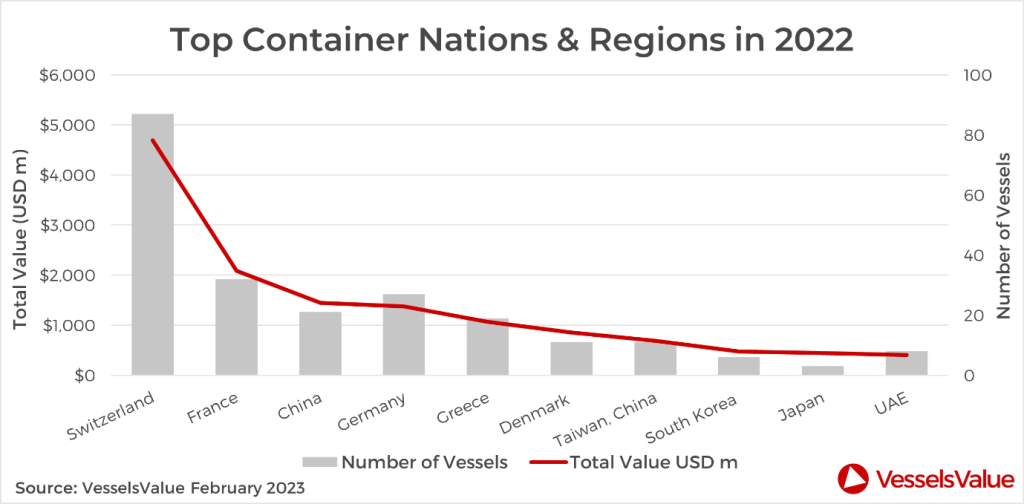
The Swiss were the largest purchases of Containers in 2021, with MSC dominating the S&P market with a total of 87 purchases, equating to a total spend of c.USD 4.7 bn. The second biggest buyers were CMA CGM with a total of 34 vessels purchased, totalling c.USD 2.1 bn.
In a benchmark deal, the Post Panamax Talassa (5,527 TEU, Feb 2005, CSBC Kaohsiung) sold in April to Tailwind Shipping, the newly founded Shipping arm of major retailer LIDL from Germany, for an incredible USD 109.5 mil, VV value USD 94.40 mil. At the time when TC earnings were at the peak in July, the Post Panamax Northern Jupiter (8,814 TEU, Feb 2010, Daewoo) sold to Moller Maersk for USD 134.0 mil. VV value USD 137.42 mil.
Asiatic Lloyd sold their Feedermax Asiatic Reunion (1,049 TEU, Aug 2008, Dae Sun) in August just before the market cooled off significantly to unknown Far Eastern buyers for USD 18.5 mil, VV value USD 21.64 mil. The value back in 2020, before the rise in the Container market, was around USD 5.3 mil.
Since the beginning of September, the Container market has seen a drastic downward correction, which can be seen in the sale of the Northern Jasper (8,814, Aug 2009, Daewoo), the sister vessel of the Northern Jupiter that was sold to MSC in October for ‘only’ USD 85.0 mil. This is a difference of USD 49.0 mil between the deals of the sister vessels in just 3 months.
Notable sales include:
- Post Panamax Navios Unite & Navios Utmost (8,204 TEU, Aug & Oct 2006, HHI) sold in February in an en bloc deal to MSC for USD 220.0 mil, VV value USD 231.4 mil
- Post Panamax Cap Capricorn (3,884 TEU, Oct 2013, Zhejiang Shipbuilding) sold in July to CMA CGM for USD 75.0 mil, VV value USD 77.23 mil
- Post Panamax Allegoria (5,527 TEU, April 2006, Kaohsiung) sold to Wan Hai Lines in March for USD 109.5 mil, VV value USD 91.35 mil
- Sub Panamax AS Patricia (2,474 TEU, Sep 2006, SSW Fahr) sold in January to Bridgefort Maritime for USD 34.3 mil, VV value USD 32.44 mil
- Feedermax Talisker (1,129 TEU, Oct 2001, Stocznia Gdynia) sold in March to MSC for USD 17.0 mil, VV value USD 16.3 mil
Gas
LNG Values
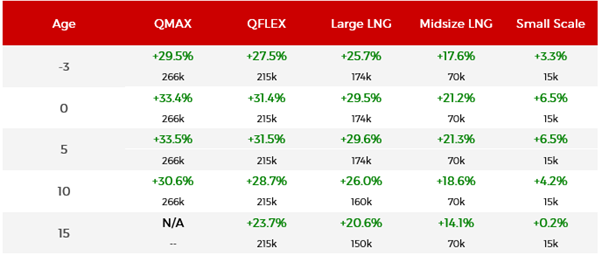
Alongside the Tanker market, the LNG Values for LNG carriers increased across all sectors and size categories since the start of January. Values for five year old Large LNG carriers rose to an all time high by the end of December, up 29.6% from the start of the year from USD 164.67 mil to USD 213.35 mil.
This spike in values comes as LNG earnings reach historic highs, surpassing last year’s record breaking peak. Rates for the BLNG1g assessment from the Baltic Exchange reached a historical 466,524 USD/Day up 52% YoY.
Soaring rates and values come off the back of the global energy crisis, as a combination of sanctions and disruption to the Nord Stream 2 pipeline led to loss of Russian LNG volumes to Europe. This resulted in high demand from European economies seeking to secure energy supply in the run up the Northern Hemisphere winter.
With LNG requirements sourced from further afield, tonne mile demand for the LNG sector increased, pushing up both rates and values.
This table shows the yearly % change from 1st January to 31st December 2022 by age:
LNG S&P
The total value of LNG sale and purchase transactions that took place in 2022 was USD 8.59 bn, an increase of 145% year on year from USD 3.5 bn in 2021. In comparison, the number of sales rose by c.61% from 36 in 2021 to 58 in 2022. The majority of vessels sold were built between 2013 and 2017.
Whilst the sales focussed on modern Large LNG carriers, the strong S&P market resulted in older Steam Turbine units increasing in value, with several of the 15 to 20 year old turbine powered vessels changing hands in H2. Soaring rates meant buyers were willing to purchase and operate these vessels, despite many approaching demolition age.
Notable sales:
- Large LNG Trader II (138,000 DWT, Nov 2002, Samsung) sold for USD 33 mil, VV value USD 35.24 mil
- Large LNG Kmarin Emerald (155,000 DWT, Jul 2007, Hyundai Heavy Ind) sold by Societe Generale to CMB Financial for USD 72 mil, VV value USD 80.55 mil with a BBC included to Thenamaris
- Large LNG Hull 8196 (174,000 DWT, Jan 2025, Hyundai Samho Heavy Ind) sold for USD 231.7 mil, VV value USD 223.22 mil and Hull 8197 (174,000 DWT, Feb 2025, Hyundai Samho Heavy Ind) sold for USD 231.7 mil, VV value USD 223.22 mil both as resales from the yard to Eastern Pacific
- Large LNG Methane Heather Sally (145,000 CBM, Jun 2007, Samsung) sold to HuaXia Financial Leasing BBCB for USD 50,0 mil, VV Value USD 69.3 mil. Turbine engine fitted
- Large LNG Puteri Intan Satu (138,100 CBM, Aug 2002, Mitsubishi HI) sold to Capital Gas, laid up and out of class for USD 32.5 mil, VV Value 43.4 mil. Turbine engine fitted
LPG Values
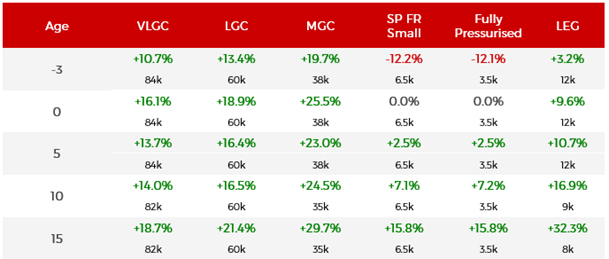
Values for the LPG sector increased across most sub sectors and size ranges since the start of the year. However, the Midsize Gas Carrier (MGC) sector saw the most impressive gains, particularly for older, 15 year old vessels of 35,000 CBM that increased by c.30% YoY from USD 24.31 mil to USD 31.53 mil.
Values were driven by an exceptionally strong market in 2022, owing to increased demand, particularly in the second half of 2022, which has historically been driven by seasonality consumption. LPG imports into China and Asia have increased by about 10% YoY, as a result of petrol chemical feed switching to propane and residential market growth. US LPG propane production saw a c.9% growth in the second half of 2022, and butane production a c.10% growth from 2021. Increased pressure on the Panama Canal from other ship types such as Containers and Bulkers caused a sharp increase in waiting times for LPG carriers. This led to tighter fleet supply and contributed to inflated charter rates and hence a firming to values, particularly in the second half of 2022.
This table shows the yearly % change from 1st January to 31st December 2022 by age.
LPG S&P
Last year, a total of 127 sales transactions took place, an increase of c.40% YoY with a total value of USD 4.6 bn, which has almost doubled from USD 2.4 bn in 2021. The LPG sector also leaned towards larger vessels with the VLGC category the most popular, accounting for c. 37% of sales with the majority built from 2008 onwards. The highest number of purchases came from buyers based in Japan that accounted for around 12%, and the UAE ranked second with c.10%. Buyers included Doun Kisen of Japan and UAE based ADNOC who purchased two VLGC vessels in the summer of 2022.
Notable sales:
- VLGC LPG BW Austria (84,614 CBM, Mar 2009, Daewoo) sold for USD 59 mil, VV value 61.59 mil and the BW Odin (82,000 CBM, Mar 2009, Hyundai Heavy Ind) sold to FGAS Petrol for USD 59 mil, VV value USD 60.52 mil
- MGC LPG Bastogne (35,229 CBM, Nov 2002, Hyundai Heavy Ind) sold for USD 23.5 mil, VV value USD 24 mil to unknown Middle Eastern buyers
- VLGC LPGL Bellavista Explorer (90,000 CBM, Jul 2021, Hyundai Samho Heavy Ind) sold for USD 93 mil, VV value USD 87.97 mil. Monte Vista (90,000 CBM, Oct 2021, Hyundai Samho Heavy Ind) sold for USD 93 mil, VV value USD 88.81 mil to Trafigura
Conclusion
This year continued to be a tale of two halves for S&P and values. While Tanker owners have benefitted from a boom in rates and the ensuing growth in asset values, it remains to be seen if this growth can be upheld in the coming year. On the other hand, Bulker and Container owners have seen a softer second half of the year. There is a lot depending on the outlook for the global economy and the outcome of the reopening of China, following a relaxation of Covid-19 regulations and if this will provide a spur in demand for both sectors.
Disclaimer: The purpose of this blog is to provide general information and not to provide advice or guidance in relation to particular circumstances. Readers should not make decisions in reliance on any statement or opinion contained in this blog.
Want to know more about how our
data can help you assess the market?