
2024 Half Year Review: Bulkers
These half year reviews provide a summary analysis of the first half of 2024 in the tanker, container, offshore, and LNG / LPG sectors. In each, we explore three areas: the newbuild market, second-hand sale and purchase activities, and demolition trends. Combining Veson’s extensive datasets with many decades of combined experience among our analysts, these insightful reports provide clarity on the key factors influencing each market and the potential implications for stakeholders in the months ahead.
Bulker summary
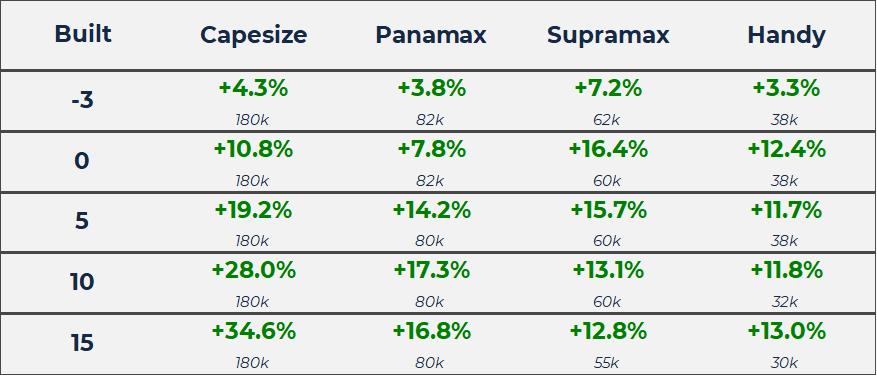
In the bulk ship sector, the first half of 2024 has been characterised by the continuing of previous trends in newbuilding, sale and purchase activities, and demolition levels. Values for Bulkers have gone from strength to strength, rising across all age sectors and sub types with the most dramatic increases seen in the Capesizes where values for 15 year-old vessels of 180,000 DWT increased by c.34.6% in the first six months of 2024 from USD 22.09 mil to USD 29.74 mil. This has been led by robust earnings for Bulkers, driven by the rerouting of vessels from the Red Sea. So far this year, there has been a 30% reduction in Bulkers transiting through the Suez Canal, as many reroute around the Capes. The longer distances required is increasing ton mile demand and this is having significant impact on the earnings in the short term.
VV Mini Matrix – Change ($m/DWT)
Newbuildings
Overall, the orderbook levels for bulkers have remained low, and ordering activity has been somewhat restrained due to high newbuilding prices and uncertainty over new fuel options.
Total bulker orders have fallen by c.13% year on year with 183 orders placed in the first six months of 2024 compared to 211 for the same period last year. Bulker orders have declined this year as newbuilding prices have risen across the board to the highest levels in 15 years and this has potentially put off some prospective buyers. For example, values for <3YO Supramaxes of 62,000 DWT climbed by approximately 7.15% in the first half of 2024 from USD 35.36 mil to USD 37.89 mil.
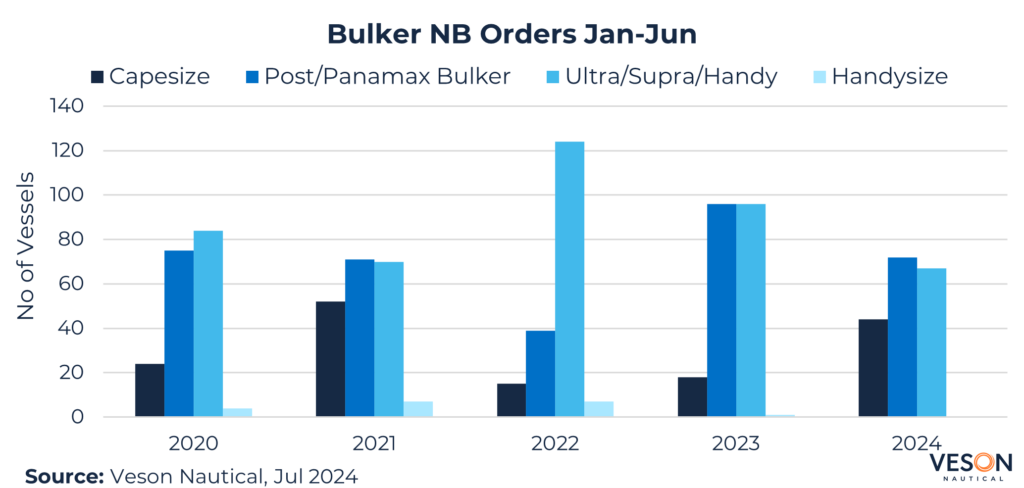
So far this year the Post/Panamax bulker sector has seen the highest volume of orders, overtaking the Ultra/Supra/Handy sector and accounting for c.39% of bulker orders with a total of 72 vessels ordered. Ultra/Supra/Handys have fallen from joint first place last year to rank second with 67 vessels ordered and a share of c.37%. In third place, Capesizes have a share of c.24%, however year-on-year orders have shot up from 18 last year to 44 in 2024 to date, an increase of c.144%. No Handysize orders have been placed this year as owners look to the larger capacity of the Ultra/Supra/Handy sectors.
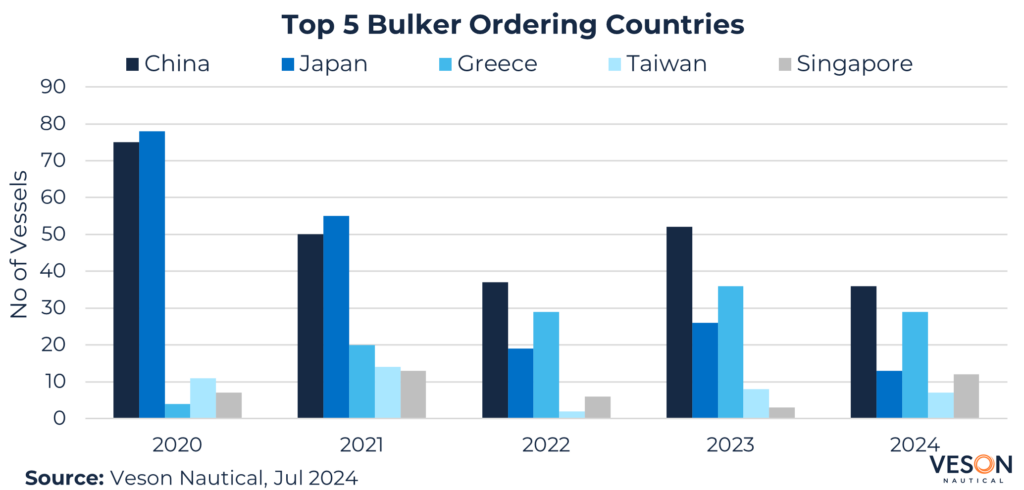
Chinese owners have dominated bulker orders this year with 36 contracts signed in the first half of the year, accounting for c.17% of all orders. Greece came in second with 29 orders and a share of c.14%, Japan ranked third with 13 new Bulkers scheduled accounting for c.6%, followed by Singapore with 12. In fifth place is Taiwan with seven new Bulkers ordered.
Headline orders include:
- 8 x 210,000 DWT Newcastlemax Capesizes by China Merchants Shipping, set to be built at New Times Shipbuilding and delivered between 2028-2029 and contracted en bloc for USD 75.81 mil each, VV value USD 75.59 mil.
- 6 x 325,000 DWT Capesize ore carriers by Winning Shipping, set to be built at Hengli Shipbuilding and delivered between 2027-2028 and contracted en bloc for USD 116 mil each, VV value USD 93.6 mil.
- 3 x 64,100 DWT Ultramaxes by IHB Shipping, set to be built at New Dayang Shipbuilding and delivered between 2027-2028 and contracted en bloc for USD 35.5 mil, VV value USD 35.34 mil.

Chinese yards have received the lion’s share of bulker orders once again, accounting for over three quarters of the 2024 orderbook to date with 165 vessels and a share of c.79%. Japanese bulker orders have fallen significantly year on year with just 34 new contracts compared to 62 for the same period last year, a fall of c.45%. Nevertheless, Japan retains the second place slot with a share of c.16%. In third place is the Philippines which has also seen its orders fall by 50% year on year with six new orders placed and a share of c.3%.
Sale and Purchase
The level of overall bulker sale and purchase transactions has increased by c.5% YoY with 582 bulkers changing hands in 1H 2024 compared to 554 for the same period last year. This is due to an increase in popularity for larger bulkers where sales for Capesizes have grown by c.34% YoY and Post/Panamax Bulkers by c.17%, encouraged by the small price differentials between Panamax Bulkers and Ultramaxes. In addition, the surge in demand for larger bulkers is, in part, because of the situation in the Red Sea where vessels have been forced to reroute around the Cape of Good Hope. Increased ton-mile demand for bulkers has also increased S&P demand for secondhand vessels.
Secondhand values for bulkers have grown across all size categories and age ranges. Older Capesizes have seen the most growth with values for 20-year-old vessels of 180,000 DWT at the highest levels in 15 years and up by c.37.88% since January up from USD 13.86 mil to USD 19.11 mil.
Notable sales include
- Capesize BC Cape Keystone (179,300 DWT, Dec 2011, Hyundai HI Ulsan) sold to unknown Chinese buyers for USD 32.50 mil, VV Value USD 34.4 mil.
- Panamax BC Bravery (76,600 DWT, Sep 2004, Imabari) sold to undisclosed buyers for USD 12.5 mil, VV Value USD 11.8 mil.
- Supramax BC Bright Hero (55,600 DWT, Oct 2010, Mitsui Ichihara) sold to undisclosed buyers for USD 16.7 mil, VV Value USD 17.80 mil.
- Handy BC (Open Hatch) Sider Eva Maria (39,000 DWT, Mar 2014, Chengxi) sold to unknown Greek buyers for USD 21.0 mil, VV Value USD 19.27 mil.
Although the number of sales has fallen by c. 12 YoY, the Ultra/Supra/Handy sector continues to lead the way with a market share of 33% and 188 sales reported. In second place is the Handysize sector, where the number of transactions has also fallen slightly by c.4% YoY. So far this year, 152 sales have been reported in this category, representing c.27%. In third place is the Post/Panamax bulker sector where transactions have jumped by c.17% YoY, with 128 reported in 2024 to date and representing c.23%. Finally, Capesizes rank fourth with a share of c.17%, having risen steadily over the last three years to 94 sales to date and recording a year-on-year increase of c.36%.
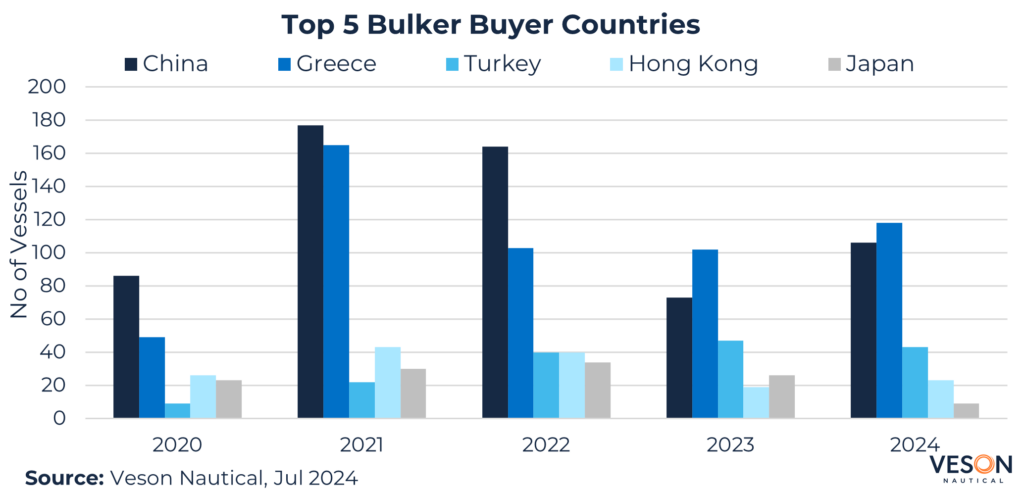
Greek owners have been the most active on the sale and purchase market once again this year, investing in 188 bulkers, representing an increase of c.16% YoY. China trails behind in second place with 106 purchases reported. This is a yearly increase of c.45%. Turkey retains third place, purchasing 43 bulkers, a drop from last year of c.9%. Hong Kong has overtaken Japan to land in fourth place with 23 purchases, an increase of c. 21% YoY. Finally, Japan are in fifth place with just 9 bulkers bought, falling from 26 last year, a decrease of c.65%.
Demolition
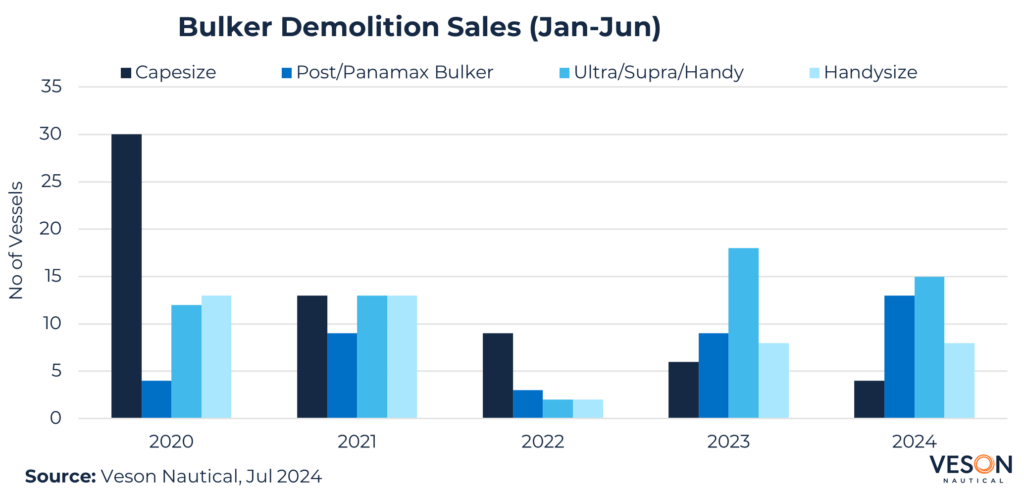
Just 40 bulkers have been sent to the breakers yard so far this year due to firm earnings and strong values, particularly for older, larger vessels. The majority of demolition activity has been in the Ultra/Supra/Handy sector with 15 vessels sent for scrap, compared to 18 last year, followed by the Post/Panamax sector with 13 demolitions, up from nine last year, an increase of c.44%. Handysizes are in third place, unchanged from last year with eight vessels scrapped. Finally, just four Capesize vessels have been demolished in 2024. This figure has declined steadily over the last five years, from 30 in 2020, representing a decrease of c.87%.
The average age of bulkers sold for demolition this year is 30 years, indicating that only the oldest vessels are being considered for scrap.
The graph below shows the average scrap price in the Indian Sub Con. This region represents the highest scrap price available between Bangladesh, India and Pakistan recycling yards.
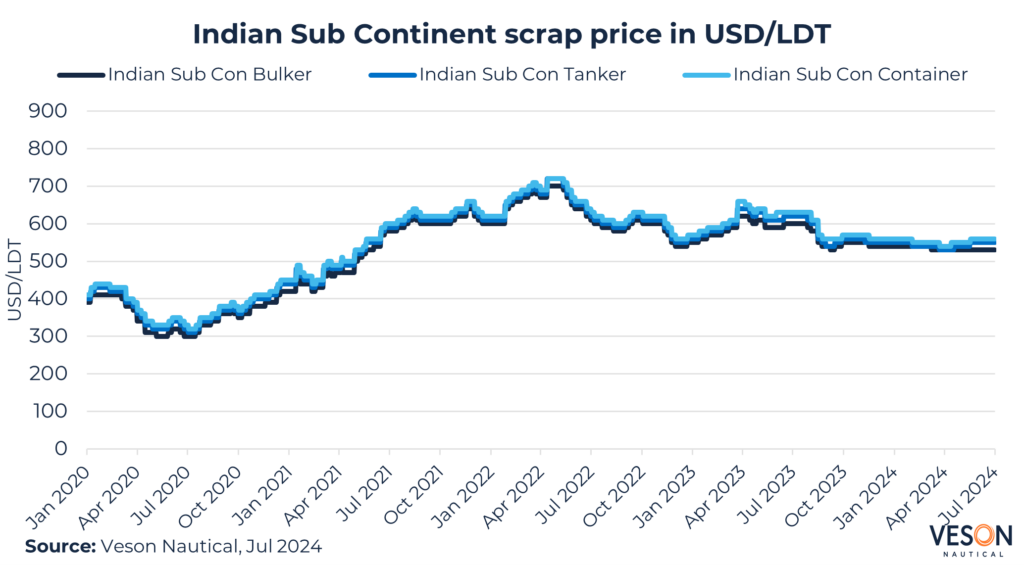
At the end of 1H 2024, scrap price is c.12% lower when compared to the scrap price at the end of 1H 2023. Indian sub-continent scrap prices dipped during Q3 2023 and have remained relatively flat since then. Current prices for bulkers are 530 USD/LDT compared to 600 USD/LDT for the same period last year.
Below are some notable recent demolition sales for bulkers:
- Panamax APJ Mahakali (70,300 DWT, Jul 1996, Sanoyas). Demo price: 525 USD/LDT, LDT 9,126 MT which equates to a VV Demo value of USD 4.67 mil. Delivery location: Bangladesh.
- Post Panamax Moshtaraka 2 (94,300 DWT, Mar 1995, Mitsubishi HI). Demo price: 540 USD/LDT, LDT 14,348 MT which equates to a VV demo value of USD 7.34 mil, Delivery Location: Unknown.
Bangladesh has accounted for the lion’s share of bulker demolitions so far in 2024, receiving c.63% of bulker scrap candidates. Pakistan followed with a share of c.18%, overtaking India where just one bulker has been scrapped this year, to date.
Conclusion
The bulker market has experienced a significant shift in demand towards larger vessels, following a period where the smaller sizes dominated the market. Newbuilding contracts have declined slightly due to high prices which are at their highest levels since 2009 due to a lack of yard availability. The exception is the Capesize segment where newbuilding activity has increased, driven by strong demand. Sale and purchase transactions have risen slightly over the past year, largely owing to demand for larger vessels, with values increasing across all sectors.
Demolition levels are low, have been limited to only the oldest vessels being sold for scrap. These trends indicate a market in flux, where demand for larger vessels is influencing investment decisions and the lifecycle for bulkers is being extended.
Stay up to date of the market by reading our full 2024 half-year review across the following sectors: