Box Ships are Booming
We’ve just added Containers to the list of vessels covered by our Trade module. This means you can now analyse cargo mile demand and see underlying vessel journeys and stoppages for the global fleet of Containerships.
Our COO, Adrian Economakis, looks at key data to determine which are the most attractive segments for owners and investors, and where the market as a whole, as well as values may be going in the next few years.
“Our Container trade service provides a data driven approach to understanding Containership demand, updated in real time and derived from individual vessel journeys. Combine with supply analysis and you have a deep insight into the fundamentals of the different Container segments”
The Containership market has been showing some significant gains across both earnings and values, particularly in the Post Panamax and New Panamax segments.
Demand and Supply
For the sake of simplicity, the Container segments have been aggregated to Large (Post Panamax sizes and above), Panamax and Small (Sub Panamax and below).
Large Containerships (Post Panamax and larger)
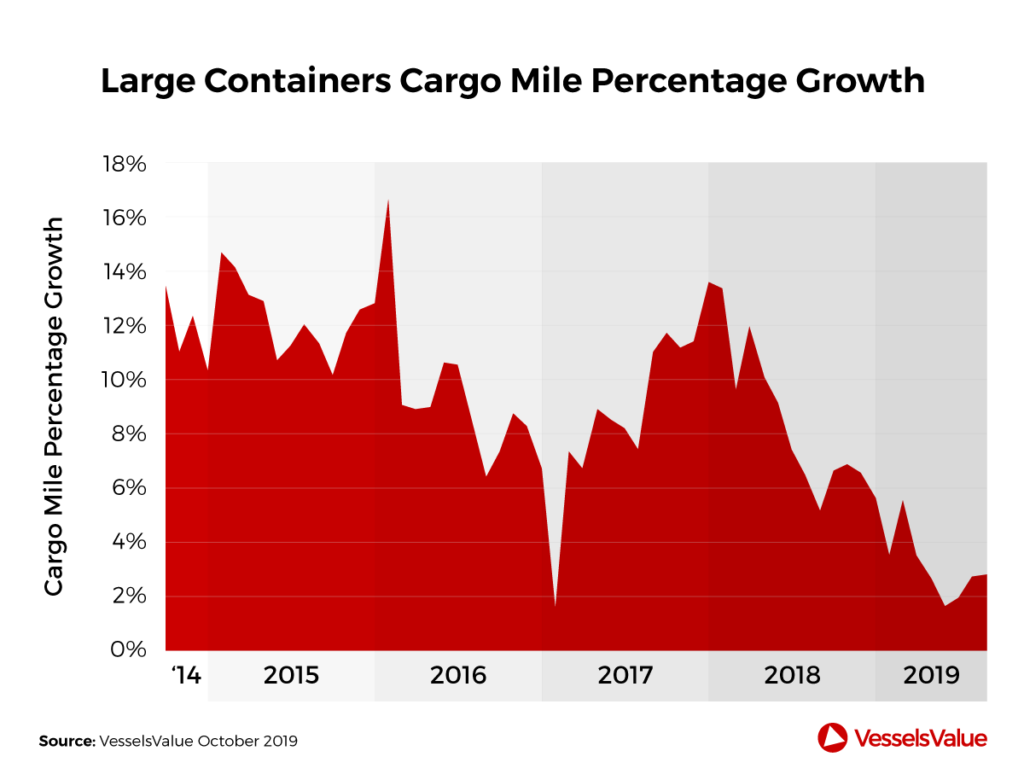
Demand growth in terms of total TEU capacity of the large Container fleet being utilised has been strong. Over the past three months demand has grown by 2.3% versus a growth in vessel supply by total TEU capacity of 1.7%. This has certainly been one of the drivers for the significant rise in charter rates over that period. However, on an annual basis, supply growth at 4.9% has outpaced demand growth at 3.3%. Over a five year period, demand and supply have been pretty well balanced with demand growing at 33.5% and supply at 33.1%.
Monthly rolling YoY percentage change for large Containership TEU mile demand can be seen on the chart below.
This is particularly interesting as the effect of the US China trade war has had a negative effect on vessel demand which can be seen in the chart below.
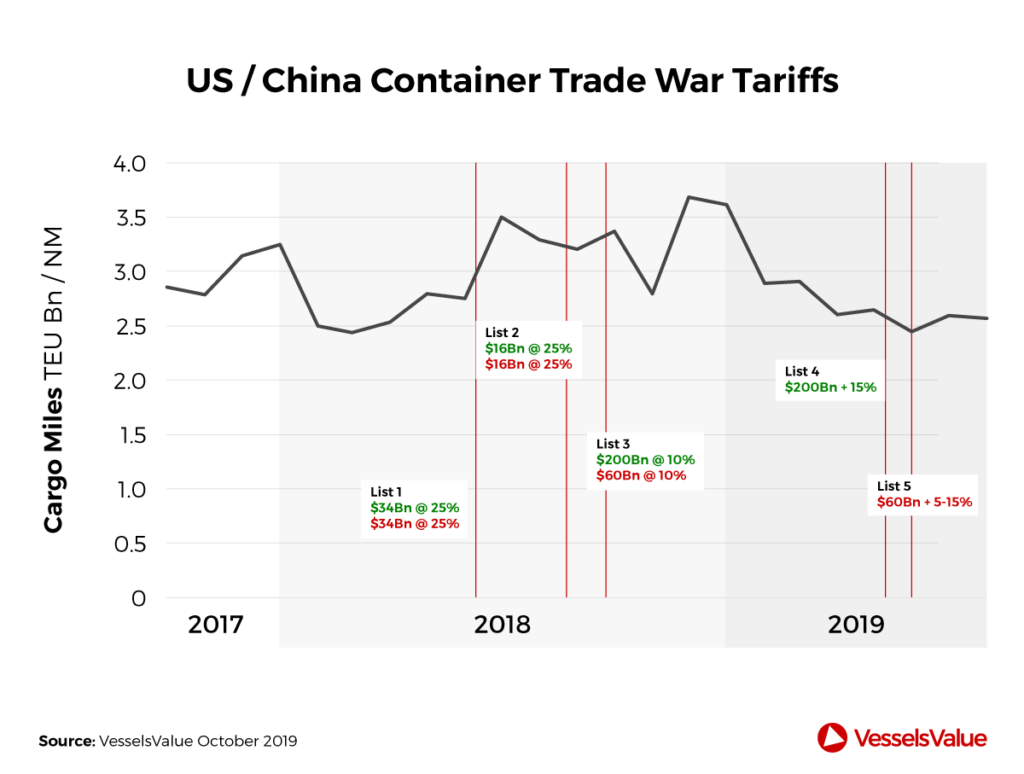
For clarity, this is the TEU mile demand from Containers doing direct trades between the US and China and does not include those that have stopped along the way. This direct trading pair indicator is a good bellwether in the effects of the China US trade was on all Containership demand between China and the US.
It can clearly be seen that the tariffs have had a significant downward effect in TEU mile demand across that route. However, as the previous data showed, global demand has been rising for the larger Containership types.
The reason for this is that other Container routes have shown significant increases over the same period. For the large sizes, data shows that South East Asia (SEA) to NW Europe has grown by 11% over the past 3 months. This can be seen in the chart below and an example of some of the recent journeys between these regions.
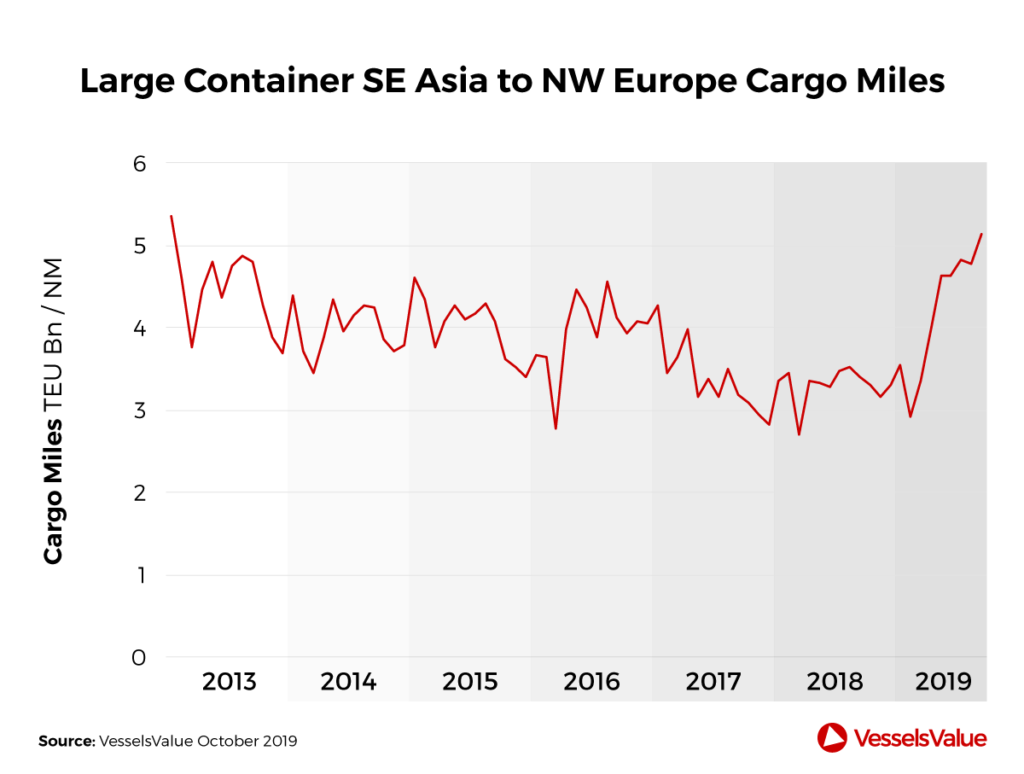
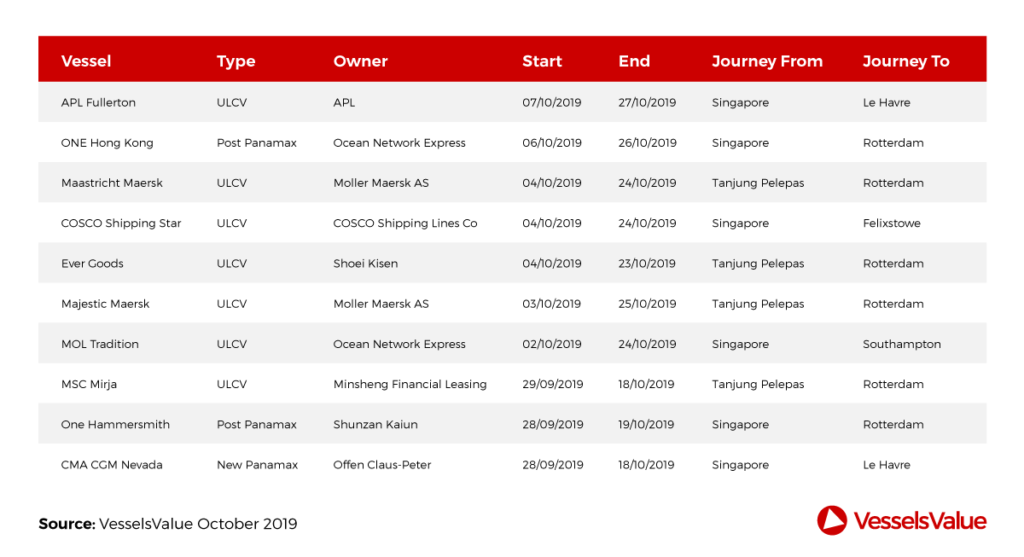
Additionally, the backhaul trade of NW Africa to SEA has increased by 91% over the same period (but much of this is due to change in routing and stoppages of those backhaul journeys as well as the increase in use of larger vessels for the trade). Also, over the past year SEA to NW Europe has risen 19% while Caribs to SEA backhaul is up 46%.
In summary, recent demand growth for large Container vessels is strong even with the negative effects of the China US Trade war.
Panamax Containerships
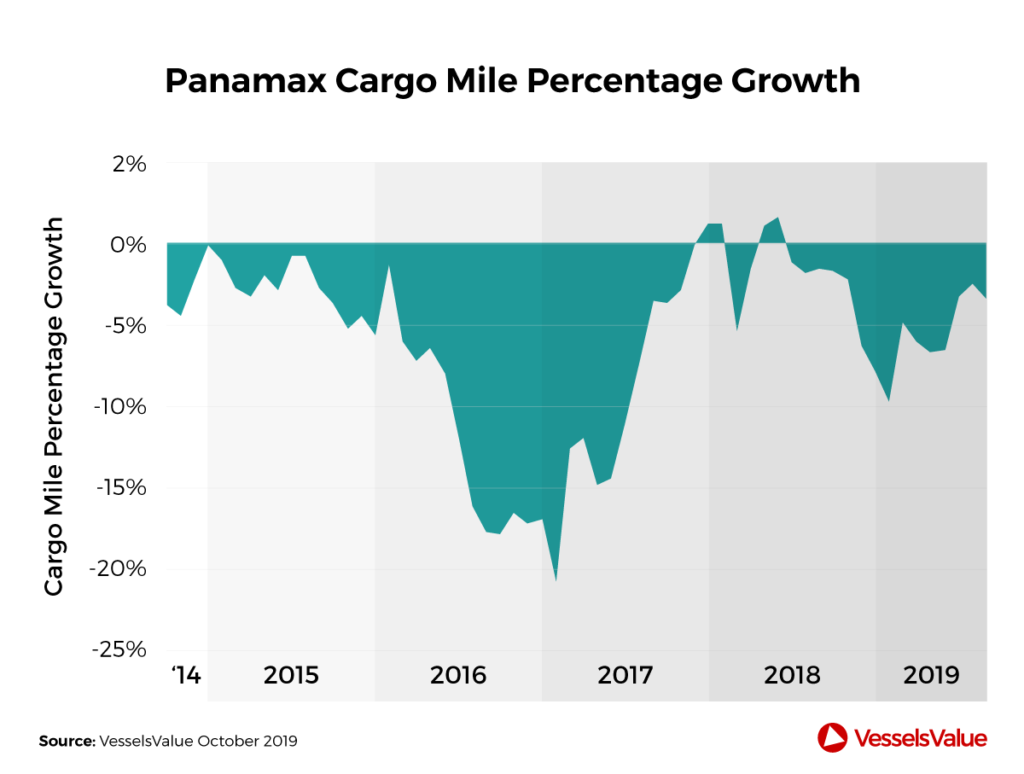
Over the past 3 months, demand for Panamax Containerships has grown at a healthy 2.1% while supply has shrunk slightly by 0.1%. However, over a longer history, the reverse is true with demand shrinkage generally outpacing supply reduction. Over the last year, Panamax TEU demand has falling by 5.6% while TEU supply has only fallen 1.3%. Over the past 5 years demand fallen 36.6% with supply falling significantly less at 22.1%.
Data shows that most of the recent rise in demand for Panamax vessels has been on the inter Asian trades increasing by 4% over last 3 months. This is even more significant over the last 5 year where panamax demand has increased 34% for the inter Asia trade. Panamax Containership TEU mile demand can be seen on the chart below (YoY percentage change rolled monthly).
Small Containerships (Handy size and below)
Over the past 3 months, demand has been flat, with supply growing at 3%, over the past 5 years, demand has fallen by 1.5% while supply has grown very moderately at 0.2%. Over the last 5 years, demand has fallen by 3.8% and supply has grown by 0.6%. Monthly rolling YoY percentage change of small Containership TEU demand can be seen on the chart below.
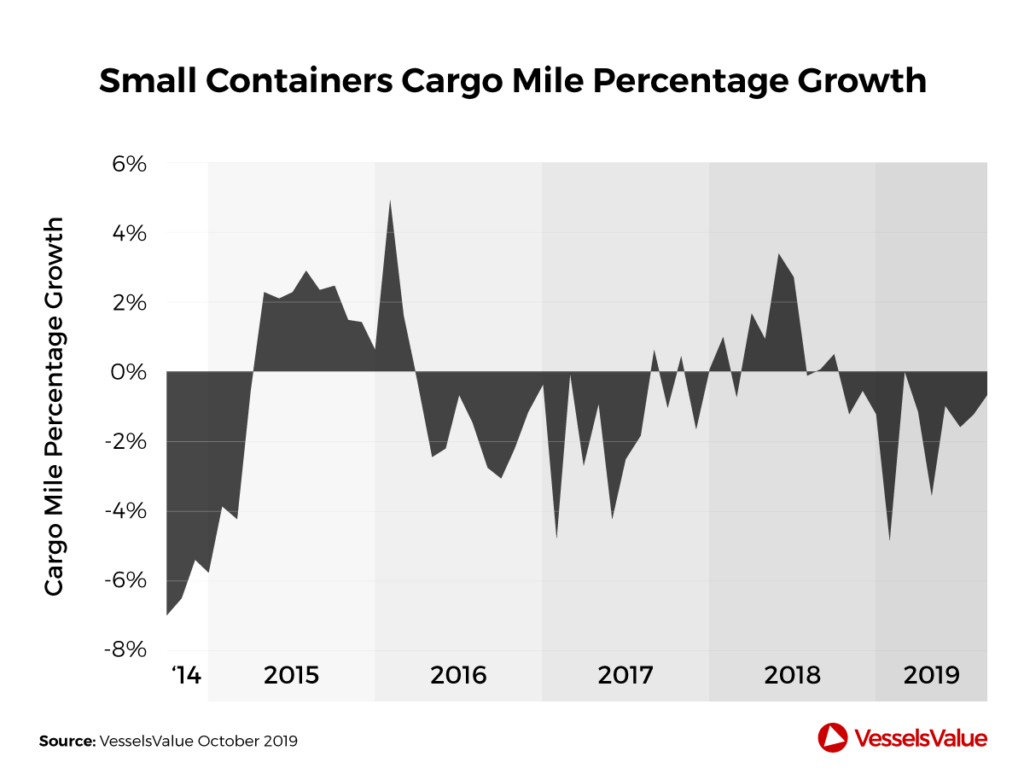
From a supply demand perspective this is not great for the smaller sectors.
Value trends, position in cycle and macroeconomic forecasts
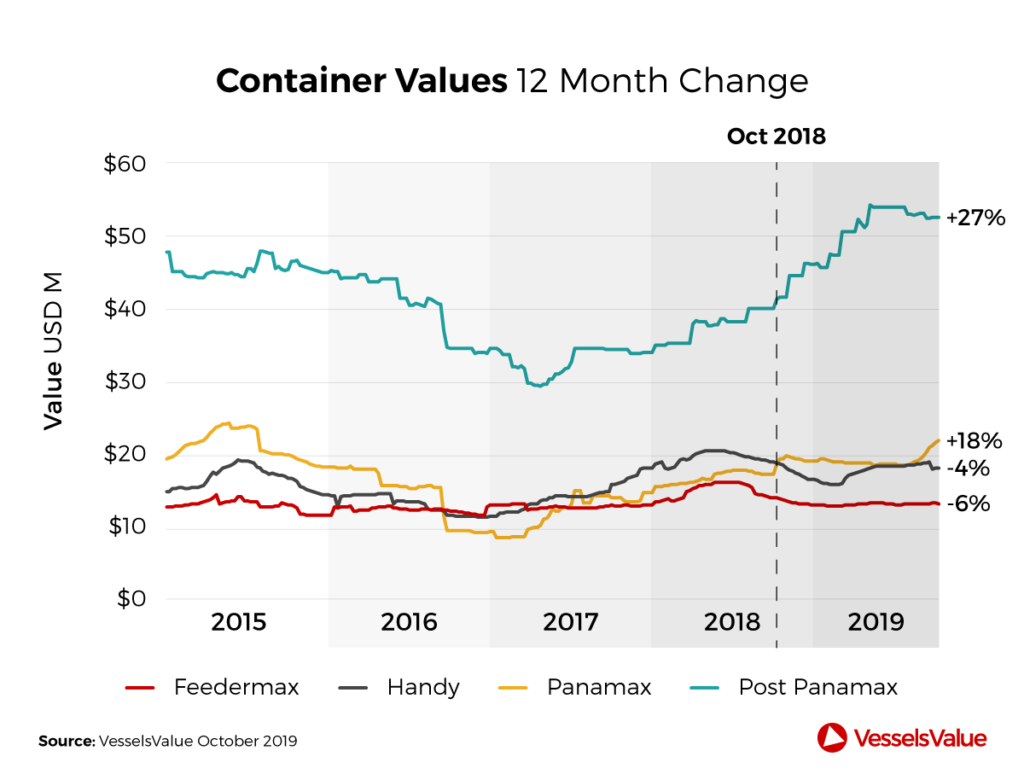
In terms of values, it’s been very much a split market, with larger Container vessels significantly outperforming the smaller types.
The chart below showing daily updated values for 5 year old standard Containerships of different types. Looking at last year change, Post Panamax values have increased by 27% YoY (with New Panamax and ULCC types following similar trend), Panamax at 17%, Handy at -4% and Feedermax at -6%.
In terms of where the current values fall within the shipping cycle, the clearest way of looking at this is current values compared against long term median values.
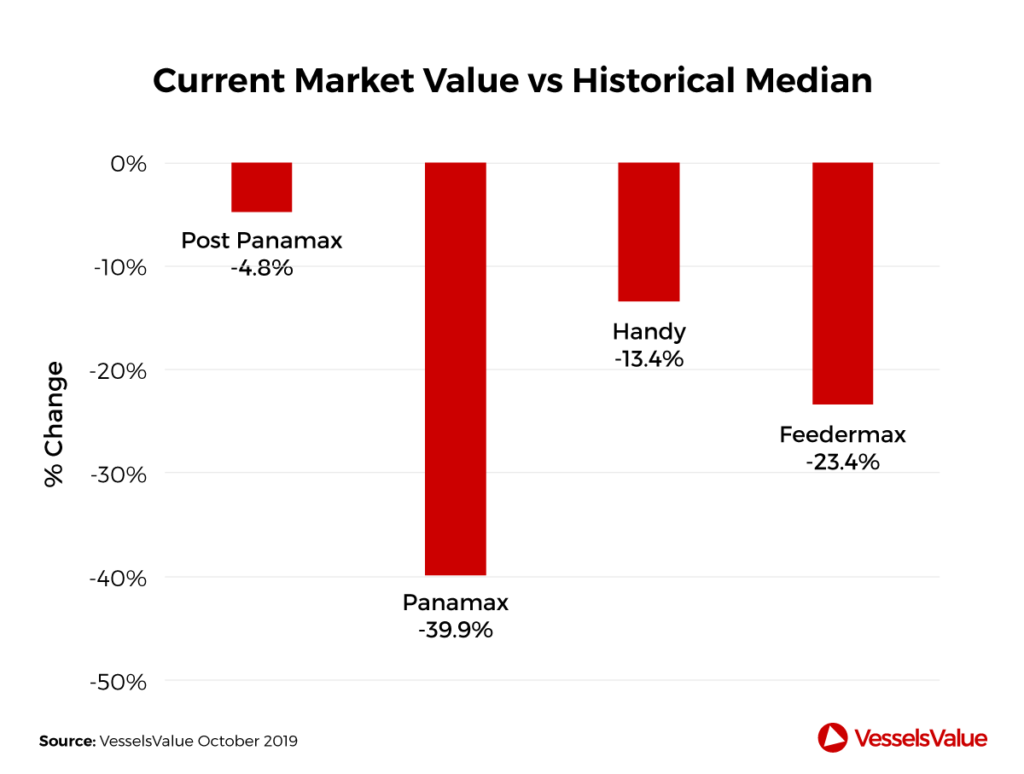
This data clearly shows that there is still significant upside potential toward long term median values, particularly in the Panamax sector.
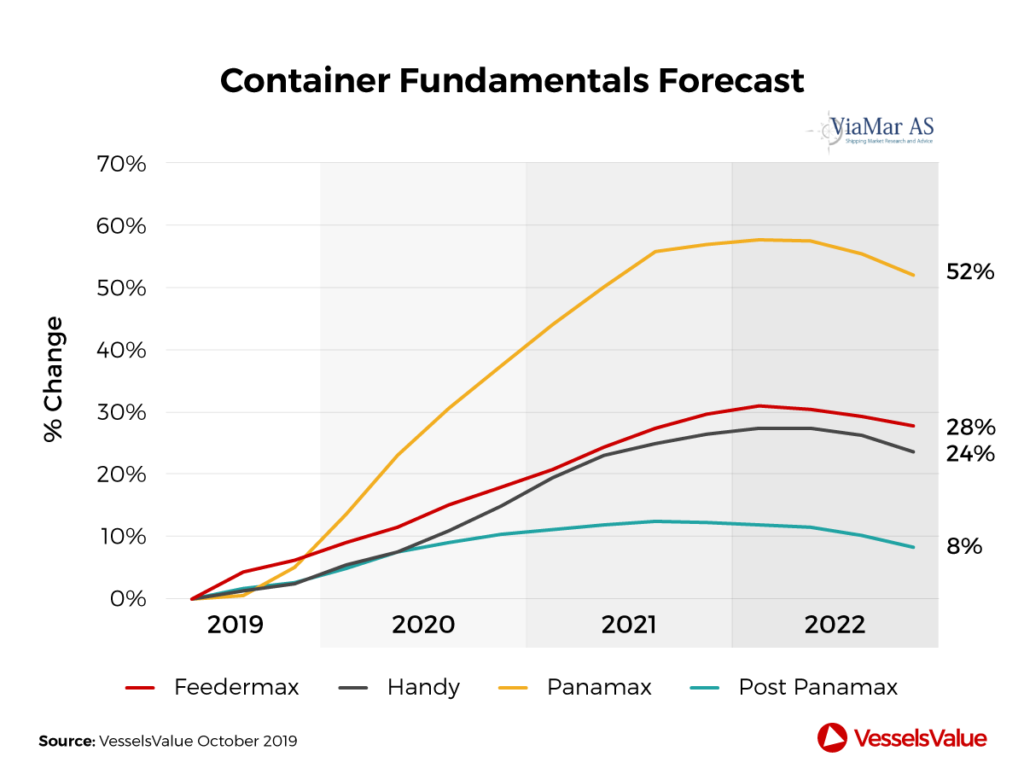
Finally, looking at 3rd party macro-economic fundamental driven forecasts, all are pointing upwards over the next few years, with the Panamax sector showing the biggest relative gains.
Summary
The best demand and supply fundamentals in the Containership market are found at Post Panamax and above sizes. However, this has already been baked into the market for these vessels with their values having risen significantly to near long term median levels. Additionally, macroeconomic derived forecasts for these larger types are more conservative than for the other Container types.
The Panamax sector is somewhat of a mixed bag. Historically, demand and supply fundamentals have been poor, with demand falling at faster rates than the shrinking supply of this vessel type. However, most recent data points to a reversal of this that if sustained could result in some significant gains in values and rates from the current distressed levels. For clarity, this is very much a distressed play as the market for these vessel types is shrinking as a whole. Therefore, the question is will supply shrink at a faster rate than demand, leading to opportunity for some short to medium terms gains.
The data for the smaller types is generally less positive, with supply growth generally exceeding demand, slightly falling values and less theoretical upside that the Panamax sector based on the position in cycle and macro-economic forecasts.
VesselsValue Trade Methodology
Demand is derived from VesselsValue’s ‘activity’ and ‘trade’ data, derived from aggregation of daily updated vessel cargo operations related stoppages and related individual vessel journeys. Supply from looking at the capacity of the on the water fleet of vessels at each corresponding time period (3 months, 1 year and 5 years related percentage changes).
Disclaimer: The purpose of this blog is to provide general information and not to provide advice or guidance in relation to particular circumstances. Readers should not make decisions in reliance on any statement or opinion contained in this blog.
Want to know more about how our
data can help you assess the market?

