
Carbon Intensity Indicator (CII): Global Fleet Impact Assessment
Introduction
Ahead of the Capital Link Annual International Shipping Forum in New York, we assessed the impact of Carbon Intensity Indicator (CII) on the global fleet using VesselsValue data.
CII is becoming increasingly influential in the sale and purchase market. At the moment, this is primarily manifesting in the liquidity of vessels. Those vessels operating in band E have substantially lower liquidity than vessels operating in other bands.
This is consistent with the expectation that vessels in band E will carry capital requirements, or will see their earnings potential reduce in the near future. There is still, however, uncertainty surrounding the timing and scale of increased investment or reduced earnings.
S&P Activity (2022)
In 2022, transactions were completed involving approximately 10% (9.9%) of the Cargo fleet. For the first time, we observe variation in liquidity relating to the CII band in which the vessel is operating.
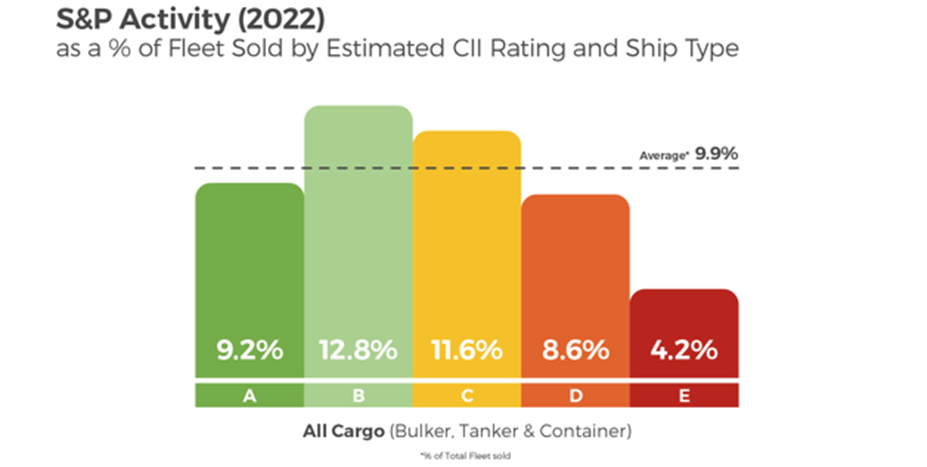
Vessels operating in CII band B were traded most frequently (12.8%), followed by those operating in band C (11.6%). These vessels represent arguably the lowest risk in relation to the incoming environmental regulations, as they have demonstrated their ability to operate in compliance with CII. Curiously, vessels in band A are traded slightly less frequently (9.2%). Owners may be reluctant to part with their most efficient vessels in an increasingly stringent regulatory environment. A value premium may be expected for these vessels, which is currently unknown.
Looking at vessels which will require a Ship Energy Efficiency Improvement Plan (SEEMP) under CII regulations, vessels in band D were also traded less frequently (8.6%). Many of these vessels will be able to reach compliance by making relatively small adjustments to their operating profile or vessel configuration. Vessels in band E were traded far less frequently (4.2%). These vessels carry the greatest risk and may become financially unviable as a result of the changes required to meet CII requirements. Buyers may expect a discount on these vessels to account for this risk.
It is worth noting that the observed effects are largely independent of vessel age.
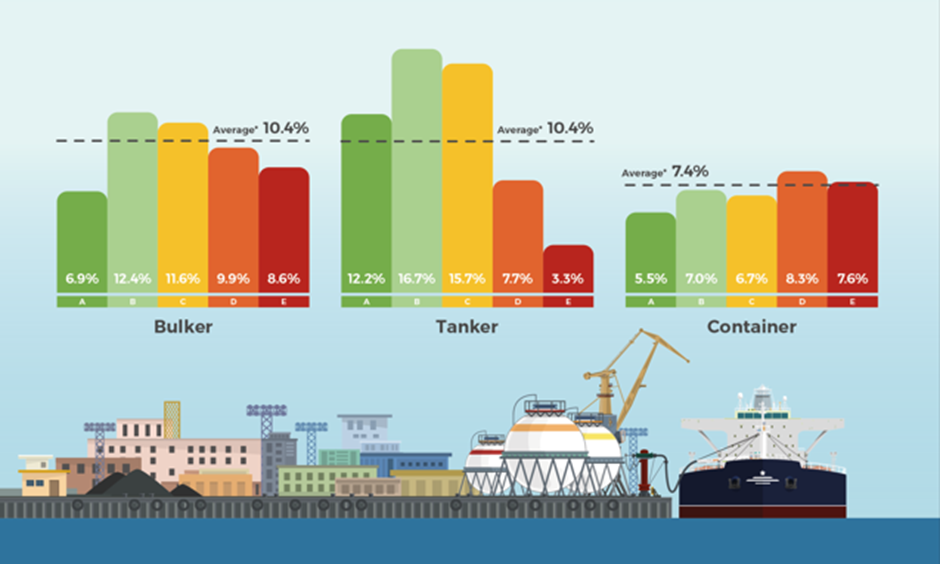
Looking more specifically at each sector, Bulker and Tanker liquidity is, on average, very similar with approximately 10% (10.4%) of each fleet being traded in 2022. However, we see that the differentiation by CII band is far more pronounced in the Tanker market. Liquidity in the Tanker market is highly concentrated in vessels operating in bands A, B and C.
Just 3.3% of Tankers operating in band E were traded in 2022, three times lower than average and almost five times lower than Tankers in band B. This may be a result of elevated public scrutiny associated with the oil majors. Market factors such as earnings are also relevant here, as Tanker rates during this period and sometime prior have been low, placing more importance on the efficiency of operations and minimising operating costs.
We have observed a rise in demand for cheaper, older Tankers that have entered into the so called ‘dark fleet’ to trade sanctioned cargoes over the past few months, potentially creating a two tier market. It remains to be seen if this is sufficient to weaken the observed trends.
The impact of CII performance on liquidity is apparent in the Bulker sector, although less pronounced than in Tanker market. Again, we see vessels in bands B and C being traded more frequently than other bands (12.4% and 11.6% respectively). We also observe very low liquidity in band A vessels. This may also be the result of reticence to sell prized assets and associated unmet premia.
Liquidity in the Container market is generally lower, averaging around 7%. We observe little to no relationship between liquidity and CII performance. This is likely due to market conditions with unprecedently high Container rates dominating 2022, when there was extremely high demand for all types of tonnage. We may see the effects emerge now that the Container rates have returned to more typical levels.
S&P Liquidity
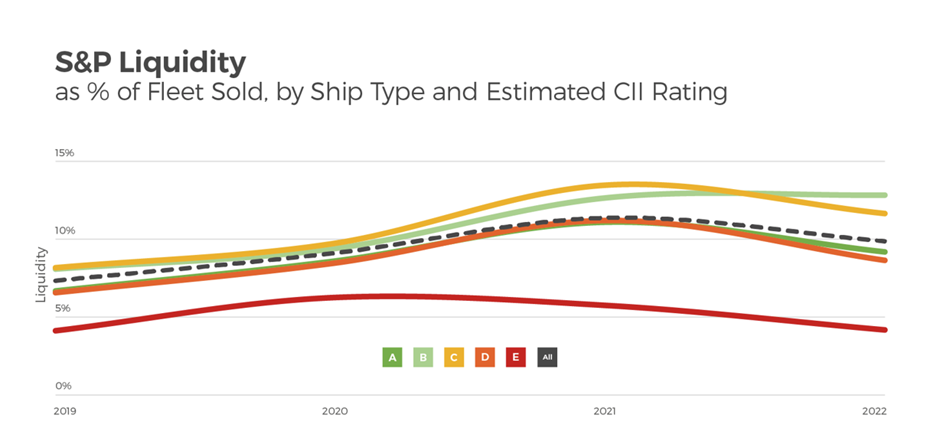
We observe liquidity in relation to CII performance changing over time. While band E vessels have had the lowest levels of liquidity, we see that the gap has widened substantially. It is worth noting that liquidity of band E vessels decreased during 2021, when liquidity of vessels operating in other bands increased substantially. On average, liquidity decreased slightly in 2022. It is also notable that the liquidity of band B vessels increased during 2022, and that the gap between average liquidity and band E liquidity persists.
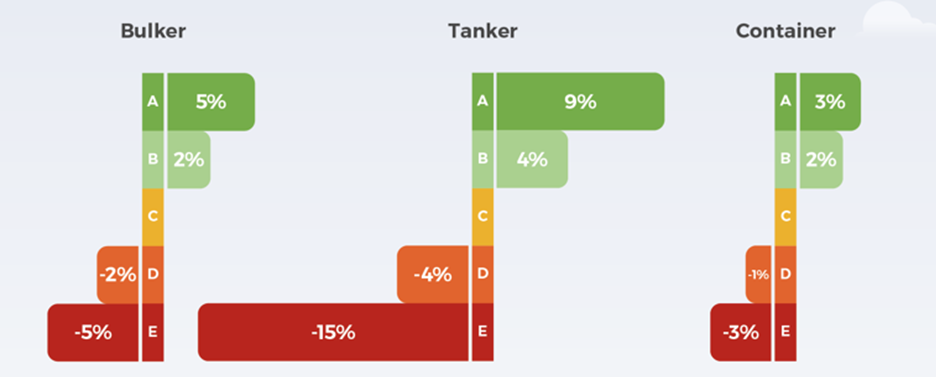
Average % Speed Adjustments Required
Changing the speed of a vessel is one of the most straightforward ways to improve the CII performance of that vessel. The average required speed adjustment demonstrates the alteration needed for vessels to operate in the centre of band C.
On average, in band A, Cargo vessels can increase speed by 9% and continue to operate in band C with no requirement for a SEEMP. Band B vessels can increase speed by 4% and remain in band C. Vessels in band D, on average, need to decrease speed by 4% to operate in band C. Band E vessels would need to reduce speed by around 12%.
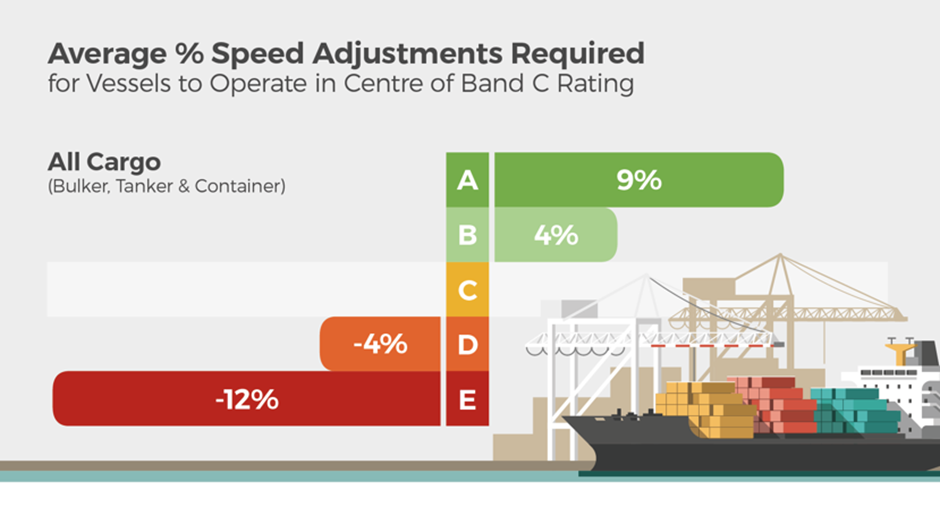
Similar to observations in liquidity, the most pronounced speed changes are required in the Tanker sector, with Bulkers and Containers requiring similar speed changes to operate in band C.
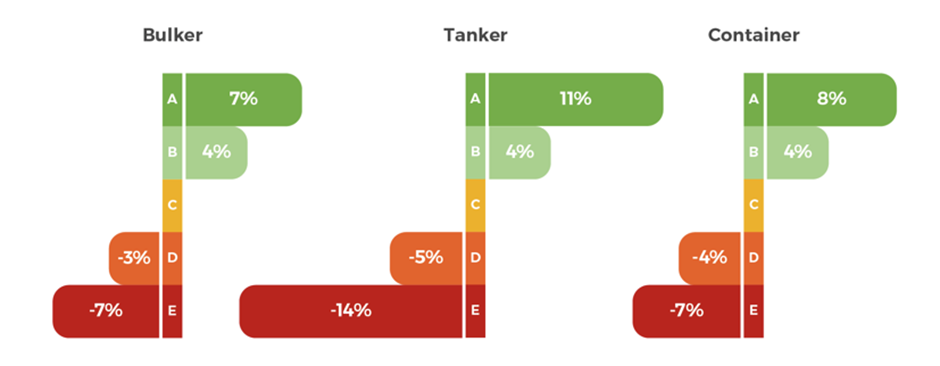
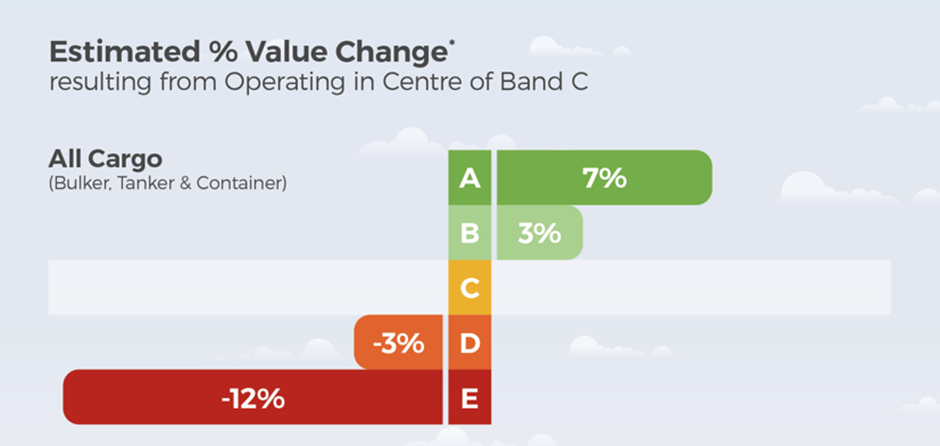
Average % Estimated Value Change from Operating in Band C
In general terms, the speed of a vessel is directly proportional to its earnings, meaning that the faster a ship is able to travel the more transportation work it can do in a given period of time. Changes in speed are therefore the same as changes in earnings.
Using our Market Value model, we are also able to determine the effect of changes in the earnings potential of a vessel on the value of that vessel. The relationship between earnings and value is different across ship types and changes over time. This can be due to shifts in other market factors, such as freight rates and steel prices.
We see that, on average across sectors, for band A vessels to operate in band C, the required 9% increase in speed would result in a 7% increase in vessel value. While for band E vessels to operate in band C, the average speed reduction of 12% would result in a discount of 12%.
Again, we observe the effects to be most prominent in the Tanker market, with band A vessels potentially able to generate an average value premium of 9%, and band E vessels suffering an average discount of 15%.
Conclusion
We are starting to observe the impact of energy efficiency regulation on the S&P market, particularly regarding the risks now associated with vessels which are operating in band E. Currently, the effects are most prominent in the Tanker market, with band E vessels trading infrequently with substantial discounts. A similar, albeit less prominent, pattern is also present in the Bulker market. We are yet to observe any significant effects in the Container market, although we expect similar patterns to emerge over time.
While this is a complex and evolving topic, we expect the observed trends to continue to develop in line with the expected impact of the regulation.
Download the full infographic.
VesselsValue data as of March 2023.
Disclaimer: The purpose of this blog is to provide general information and not to provide advice or guidance in relation to particular circumstances. Readers should not make decisions in reliance on any statement or opinion contained in this blog.
Want to know more about how our
data can help you assess the market?