
Congestion is a Big Piece of the Supply & Demand Puzzle
Introduction
Dry Bulk and Containership markets have exhibited sharp declines in earnings over the summer. Many have attributed this to a drop in congestion. However, our data shows congestion persists at high levels, though it has shifted from more visible to less visible regions of the world. In this article, we explore the drivers of congestion and consider what are the implications for supply/demand dynamics, macroeconomics and geopolitical trends.
The summer months of 2022 have seen a slow motion collapse in freight rates for both Dry Bulk Carriers and Containerships. For the former, the Capesize 54-TCA Index fell from USD 38,169 per day on 23 May 2022 to just USD 2,505 per day on 31 August 2022 and, for the latter, the Asia to US West Coast box rate slid from USD 7,900 per FEU on 16 May 2022 to USD 3,959 per FEU on 06 September 2022.
On investor calls, public companies frequently cite the unravelling of port congestion from pandemic highs as a major contributing factor. Economic theory dictates that easing congestion releases large numbers of vessels back into the market and quickly expands the available supply of tonnage. But VesselsValue’s new Congestion tool shows that, though it hits the headlines only periodically, congestion persists at stubbornly high levels in between flare ups. It just shifts to less visible regions, so should not be blamed for the collapse.
Congestion Persists in Between Headline Grabbing Flare Ups
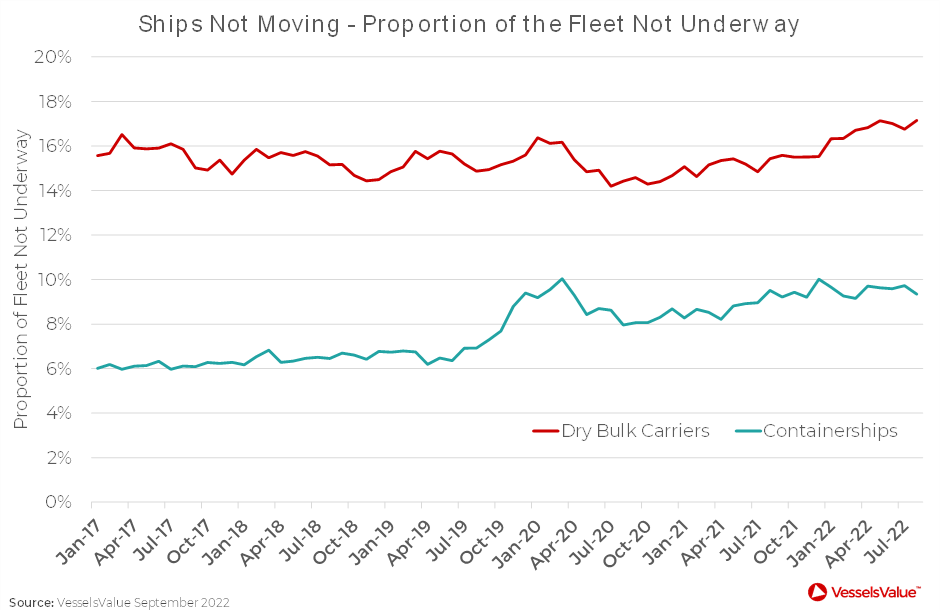
Analysts sometimes think of port congestion as a vast black hole that sucks up productive Shipping capacity and transforms it into stationary steel statues. Vessels are only productive when they are moving and Figure 1, below, shows that the proportions of both the Dry Bulk Carrier and the Containership fleets not moving remain near pandemic highs, at 17% and 9% respectively. This also includes small numbers of vessels in shipyards for repairs, surveys or dry docking and a very small number of layups. But the vast majority are vessels either waiting to load or discharge (in the case of Bulkers) or waiting for cargo operations (i.e. both loading and discharging containers, in the case of Containerships). Hence, no significant release of vessels from port congestion has occurred to impact freight markets.
The Tale of Pandemic, Told Through the Eyes of a Shipping Economist
Perhaps the clearest example of congestion shifting between regions has occurred in the US. Port congestion caught the public imagination early on in the pandemic, when staff absences afflicted LAX/Long Beach on the US West Coast, just as the population was urged to “stay home” and households abruptly switched spending from services to goods.
This did not just cause a delay to the loading and discharging of containers at the main import hub for the world’s largest economy. It also caused a delay in their onward inland distribution, both by truck and by train. As shoreside space at the port rapidly filled up, the widely reported backup of Containerships became so severe and persistent, that by late 2021, vessels were being instructed to wait up to 200 nautical miles offshore. At that radius, the water was too deep to drop anchor, so vessels simply drifted. It became a challenge to identify which ones were still underway using engine power and which were not.
By then, the shift in trade flows, and, hence, congestion was well underway. Shipping lines first diverted services to nearby San Francisco, then further afield to Portland, Seattle and even Vancouver in Canada. Then, as shown in Figure 2, below, as average waiting times for Containerships all along the US West Coast climbed steadily from just over an hour in February 2020 to 111 hours in February 2021, then further still to a peak of 146 hours in October 2021, lines began diverting services to the US East Coast. The shift became so profound that LAX/Long Beach could no longer claim to be the main import hub for the world’s largest economy. That accolade passed in 2022 to New York.
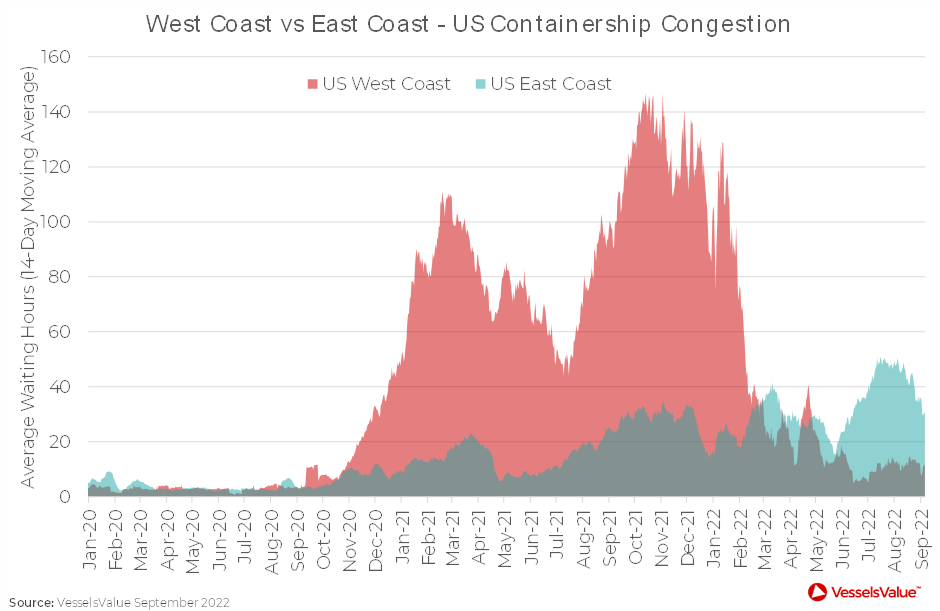
However, US East Coast ports were not immune to the parallel problems of staff absences and household’s rising demand for goods. Such was the heightened strain on New York, Savannah, and others, that, as average waiting times on the US West Coast eased back down to under 12 hours at time of writing, they ballooned to 51 hours on the US East Coast in August 2022.
Yet pockets of calm remained. As New York and Savannah creaked, Norfolk, Philadelphia, and Charleston on the US East Coast continued to function normally. Moreover, the Virginia International Gateway Terminal at the Port of Norfolk and the Wando Welch Terminal at the Port of Charleston are able to accommodate Ultra Large Container Vessels (ULCVs). So, for operators and lines with any degree of flexibility, faster and easier transit into the US, even for the largest vessels, was still possible in 2022, as long as they had good market intelligence.
Shanghai Changed the Way We Measure Congestion
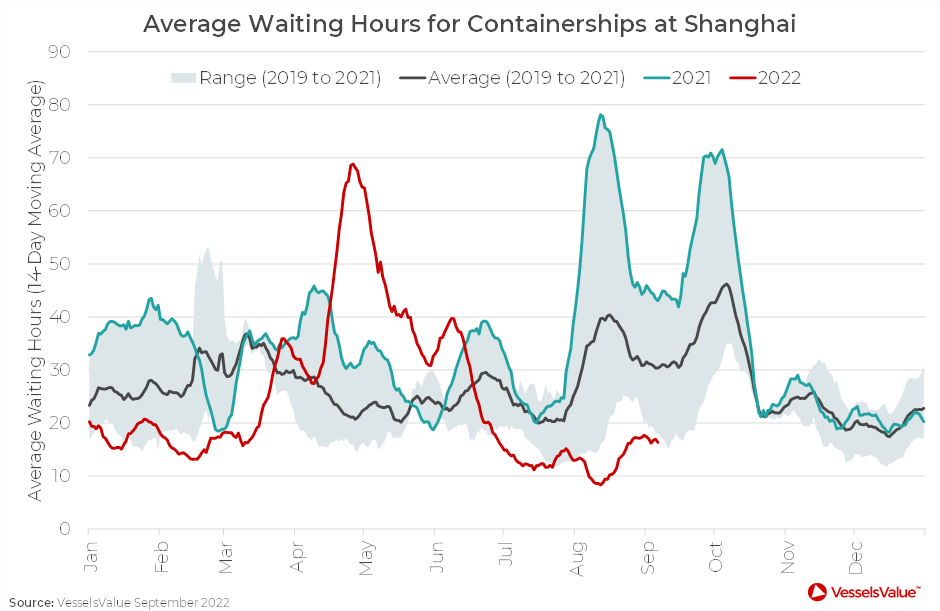
On 5th April 2022, Shanghai, the biggest city in the biggest market for most commodity Shipping sectors, went into lockdown. As 26 million people endured eight weeks of hardship, we at VesselsValue quickly realised we had to revise our methodology for measuring congestion. Simply counting vessels waiting outside Shanghai was fraught with pitfalls. Other large ports, such as Ningbo and Zhoushan to name but two, are in relatively close proximity and share an anchorage. Vessels that wait outside Shanghai may never call there and, when congestion is bad, are increasingly likely to divert to one of the others. Hence, we hit upon the idea of measuring waiting times only for those vessels that complete their journeys in the port.
Average waiting times for Containerships at Shanghai skyrocketed from 28 hours in early April (comfortably in the middle of the historical range for the time of year) to 69 hours in late April (more than double the top end of the historical range), as shown in Figure 3 below. In early June, by which time lockdown had been lifted, congestion had eased considerably, and average waiting times were almost back to last year’s levels.
Clogged Up: Conflict Forces European Power Sector Back to Coal
While we were monitoring Container ports in the Western Hemisphere for knock on effects of the Shanghai lockdown, congestion next reared its head in the Dry Bulk sector, taking the market somewhat by surprise. As shown in Figure 4 below, average waiting times for Bulkers in Northwest Europe had been above the top end of the historical range for most of the first five months of 2022. But in a two week stretch over late May/early June, they shot up vertiginously from 26 hours to 45 hours and peaked in late July at 52 hours.
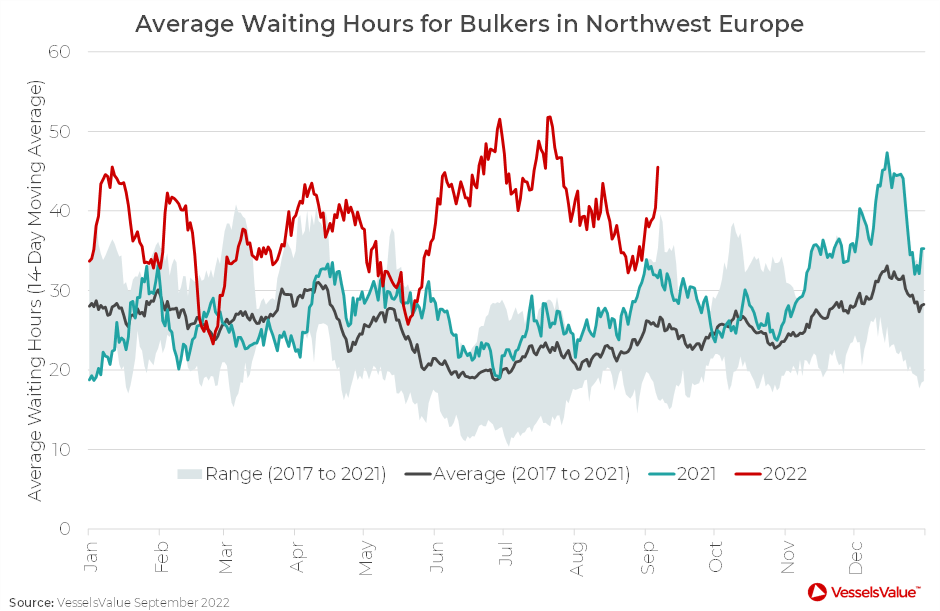
An examination of Bulker journeys into the region reveals a sudden influx of Capesizes, mostly from Richards Bay Coal Terminal in South Africa, but also from Dalrymple Bay Coal Terminal in Australia. European power utilities had long eschewed coal. The transition to cleaner fuels was underway and a well established market for carbon pricing had made coal uneconomic for most of the past decade. However, a combination of factors forced the sector back to old ways. The start of the Russia/Ukraine conflict on 24th February 2022 sent natural gas prices spiralling. A long, hot, dry summer severely depleted river levels and restricted hydropower. And the region’s two largest economies, Germany, and France, had steadily mothballed ageing nuclear plants in the wake of the Fukushima Disaster.
The result was a sudden and unexpected pressure on ports. Rotterdam in the Netherlands is Northwest Europe’s main coal import terminal. But several other countries, including France and Germany also began receiving shipments, having imported no coal from either South Africa or Australia for years. As a leading indicator, port congestion stands out as a visible symptom of Europe’s wider energy crisis.
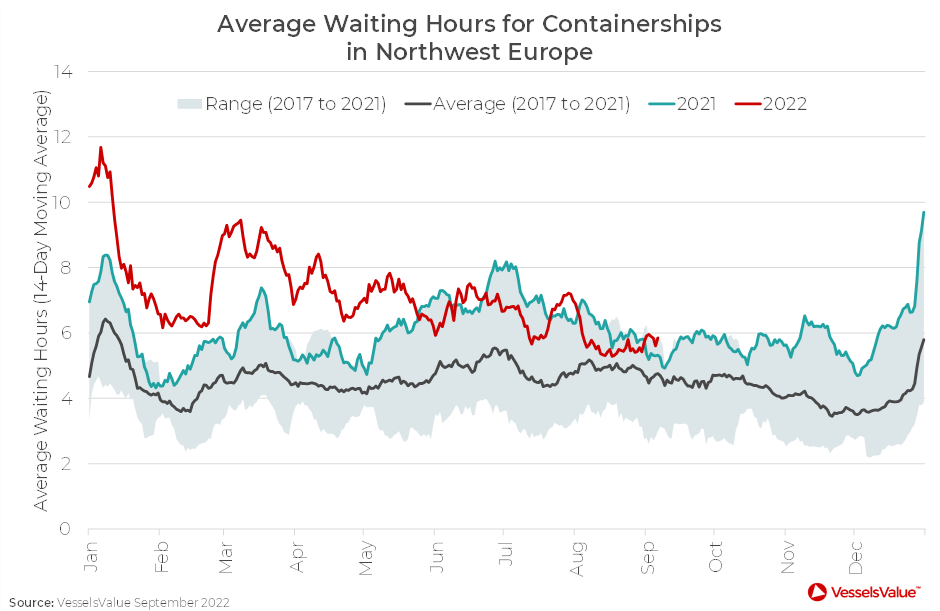
Storm on the Horizon: Port Worker Strikes
The energy crisis is, in turn, one of several factors contributing to a wider cost of living crisis, fomenting growing industrial unrest in many parts of the world. The UK was hit by an eight day port workers’ strike at its largest container port, Felixstowe, in late August 2022. This followed a two day strike at several container ports in Germany the previous month, and workers at Liverpool have also voted for a fortnight of action at the end of September 2022. Meanwhile, labour negotiations have reached a tense stage on both coasts of the US, where the phenomenon of congestion and supply chain disruptions first emerged during the pandemic, and where it may yet return.
As shown in Figure 5 below, neither July 2022’s strikes in Germany nor August 2022’s one at Felixstowe have yet significantly impacted average waiting times for Containerships in Northwest Europe, though they are flirting with the top end of the historic range. Strikes present a slightly different problem from staff absences early in the pandemic. Empty containers continue to be returned to the port by truck and train but, with no vessels to repatriate them, shoreside space fills up with “empties”. It will therefore take several weeks to evacuate the surplus following the conclusion of the strike and average waiting times may yet trend higher, tying up tonnage and reducing the productive capacity of the fleet.
Port Congestion is a Barometer of Macroeconomic and Geopolitical Trends
The last two and half years have been truly tumultuous. From the pandemic to the Russia/Ukraine conflict, the resultant energy and cost of living crises, and labour unrest, a variety of unexpected threats have surfaced to disrupt trade flows and supply chains in the major arteries and veins of the global economy. This disruption manifests itself most clearly in port congestion. It is a mistake to think that this is over and is somehow to blame for Dry Bulk and Container Shipping’s wider woes.
As a leading indicator of broader macroeconomic and geopolitical trends, Port Congestion is an essential item in the toolkit of any economist, industry analyst, scheduling planner, or supply chain senior manager.
Disclaimer: The purpose of this blog is to provide general information and not to provide advice or guidance in relation to particular circumstances. Readers should not make decisions in reliance on any statement or opinion contained in this blog.
Want to know more about how our
data can help you assess the market?