
Containerships – Earnings, Values & Demand
So far, 2020 has been a particularly challenging year for the Containership sector, which has been rattled by lengthy port delays and record numbers of idle vessels since January. Alongside many other sectors, Containerships have felt the brunt of COVID-19, with operational limitations and reduced demand for goods from China, but things are beginning to look up. Below we will be exploring reductions seen in rates and values, in relation to demand changes and recent increases across key shipping routes.
Containership Earnings
The chart below shows earnings for the main types of Containerships from the start of 2015.
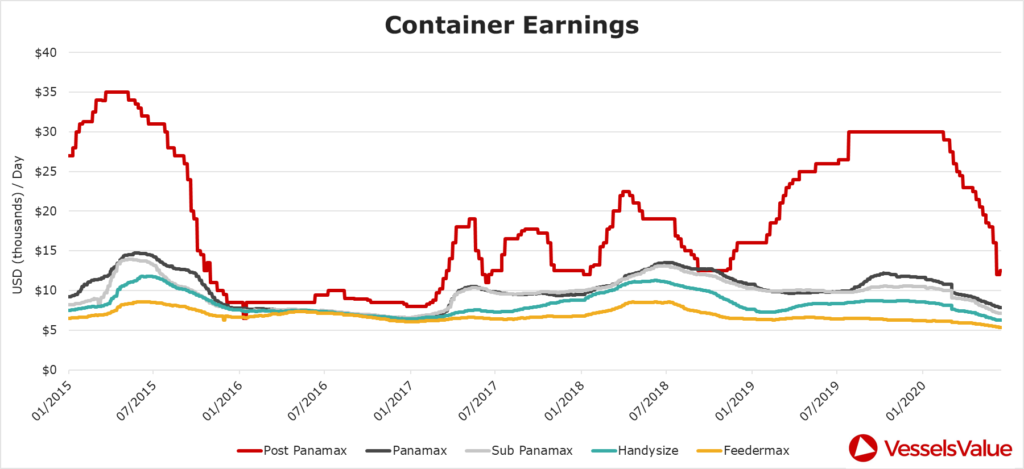
This chart clearly shows that Containership earnings have fallen significantly since the multi year highs seen at the end of 2019 and early January 2020. The most volatile type has unsurprisingly been the larger Post Panamax Containerships, who’s earnings have fallen circa 60% from $30,000 per day in early January 2020 to $12,000 in June 2020. The smaller types have also all fallen to near Operating Cost (OPEX) levels. Currently there are no signs of reversal of this trend. However, if the western economies successfully come out, and remain out of lockdown, then the rise in related consumer spending and demand for imported goods could cause these rates to recover.
Containership Values
Changes in vessel values typically reflect longer term expectation for the market than earnings. The matrix below shows changes in values for the main Containership types of different ages from the 8th of May 2020 to the 8th June 2020.
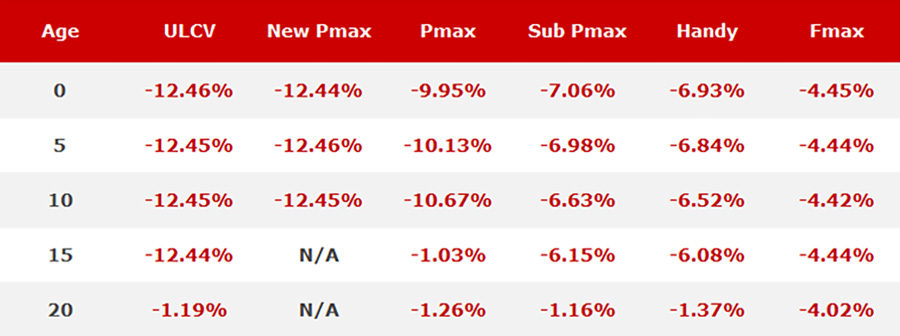
As shown, values for Containerships have fallen across all types and ages. These falls have been quite significant and fast. Part of this is due to Container values rising through 2019 as the market improved, meaning values had further to fall. However, structurally we are seeing favour move against Containerships as market participants readjust their forecasts for international and Container trade over the next years to take into account expected possible recessions in some major importing countries.
These falls in value of over 12% for the larger more modern size vessels over a 1 month period are quite significant. This is obviously an issue for owners looking to sell or refinance, but also present opportunities for buyers to lock in low prices and benefit from potential upside as the market improves due to the easing of lockdown.
Containership Demand
At VesselsValue, we measure demand for vessels through applying algorithms and analysis to the satellite and terrestrial AIS vessel location information. This provides us with objective and near real-time data on what each vessel in the global fleet is doing such as ‘on a journey’, ‘waiting to discharge’, ‘loading’ and related analytics such as estimated cargo volumes, cargo miles, speeds, port calls and more. This, in turn, allows us to analyse the current and historical daily updated trade flows at the global fleet level between ports, countries and regions.
Our demand analysis below looks at the weekly count of Container journeys starting and ending in countries and regions of interest (i.e. China and some main Container trading partners). The advantage of this method is that it clearly shows some main high-level trends, without the noise of our other our methods (such as cargo (teu) miles that also incorporates distances and speeds into the analysis).
Global trends
The chart below shows the number of weekly containership journeys globally. This covers all containerships from 1,250 teu (Handy) up to the largest 24,000 teu sizes (ULCV).
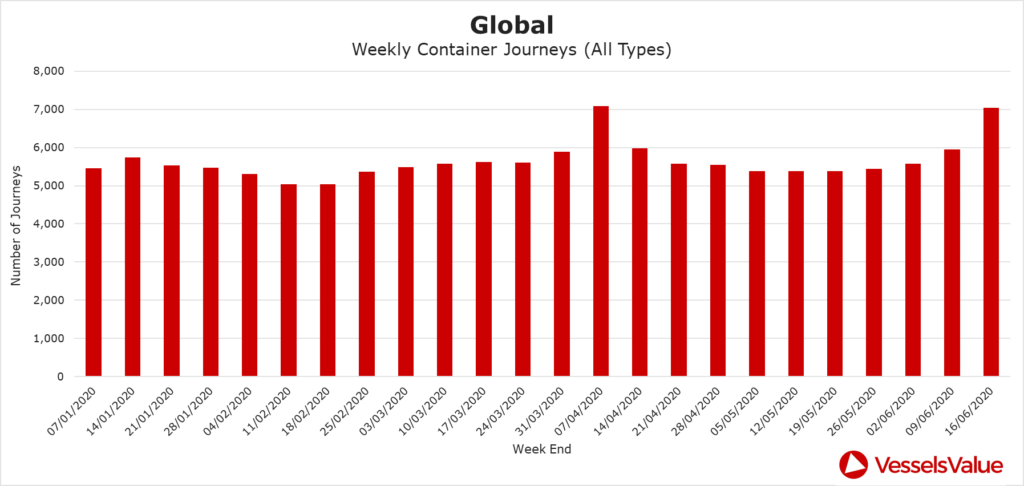
The data shows that over the last few months, demand stabilised in May and began rising significantly in June. In mid-June, demand surpassed January 2020 levels, which is a positive sign for future values and earnings across the whole Containership sector.
China to Global trends
Now looking at China specifically, the below chart shows the count of containership journeys that started in China and went anywhere else in the world (i.e. excluding China to China journeys).
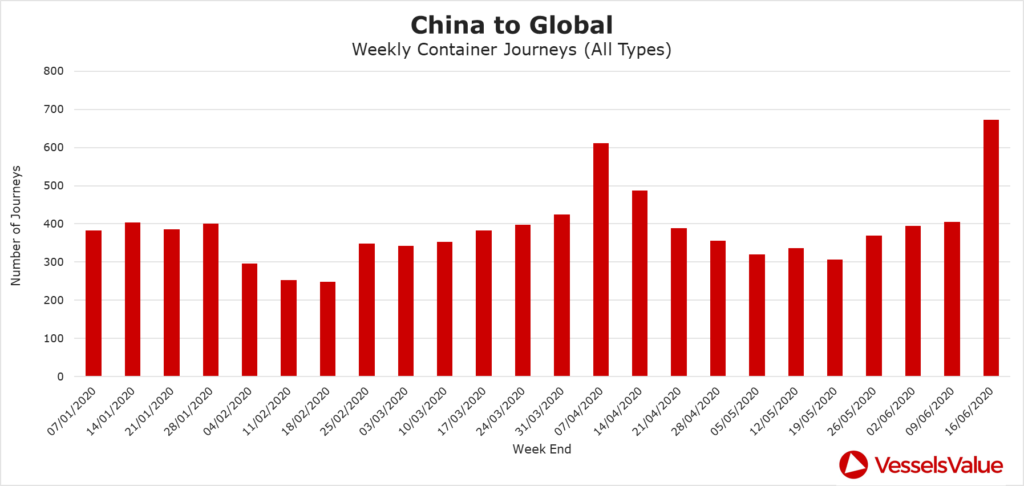
This data clearly shows that demand for Containerships out of China has started to pick up over the past few months. Journey levels spiked considerably in mid-June, exceeding figures seen pre COVID-19 in early January. This is a very positive sign and suggests demand for Chinese exports is rising again, as countries begin to ease lockdowns.
China to US trends
The below chart shows the count of Containership journeys that started in China and went to the US.
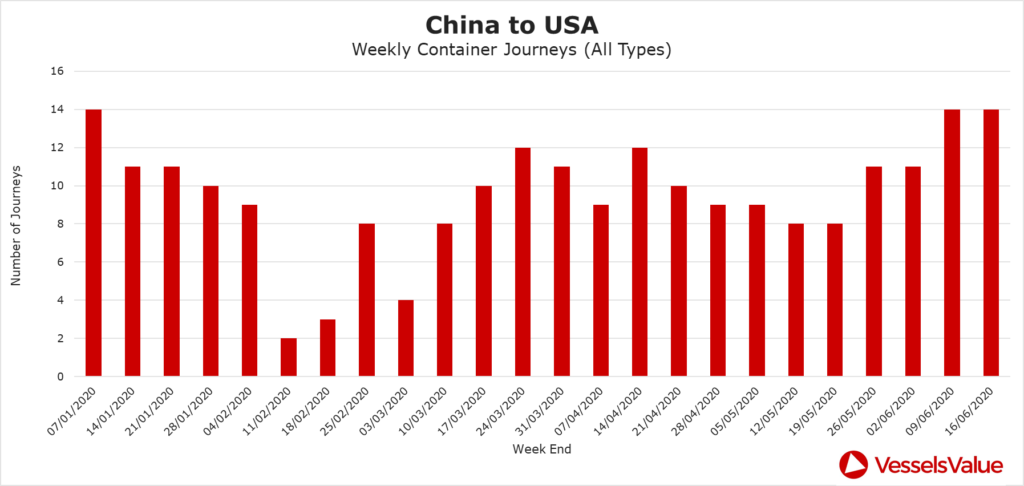
These trades are typically done by the larger vessel types (explaining the relatively low numbers compared to the global trade). This is showing more recently that as the US has started to relax their lockdown, journeys from China have quickly increased back to the same levels seen at the start of the year. This is a good sign.
China to South East Asia trends
The below chart shows the count of Containership journeys that started in China and went to the region of South East Asia.
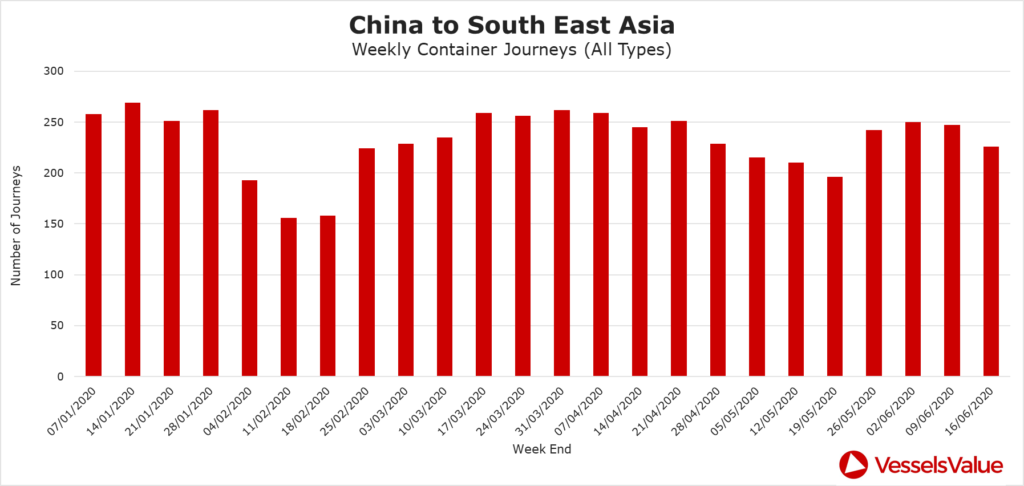
The data shows that despite levels stabilising through May into the beginning of June, Journeys to South East Asia began to decline again in mid-June. This could be cause for concern for the route if the negative growth continues.
What this tells us about the near-term future of the containership market and the world economy in general
In summary, demand is picking up globally especially out of China. Part of this is to do with how well China has managed their response to Covid-19 and the very great speed to which the Chinese economy has gotten back to work. This is very much a good sign for the Containership market.
Values and earnings have continued to fall as they move behind the changes in demand. This therefore may present a buying opportunity as demand data is pointing to a recovery but values and earnings are still low and declining.
Disclaimer: The purpose of this blog is to provide general information and not to provide advice or guidance in relation to particular circumstances. Readers should not make decisions in reliance on any statement or opinion contained in this blog.
Want to know more about how our
data can help you assess the market?