
Digging in the Wrong Place – Ukraine Crisis Distracts from Bigger Trends in Seaborne LNG Market
The Ukraine crisis has sent global gas prices sky rocketing, but there may be bigger forces at work in the seaborne LNG market. While the world awaits developments on pipeline supplies, ship tracking data on seaborne LNG volumes may assuage the worst fears.
The European benchmark TTF gas price has risen 135% so far in 2022, with a near-vertical spike since Russia commenced hostilities in Eastern Ukraine on February 24th. Russia is the world’s largest exporter of gas, and Europe is heavily reliant on this, as Russia exports approximately 23 billion cubic feet of gas every day, about half of which goes to Germany, Italy, France and Belarus. However, the vast majority is piped and neither Russia nor Europe are explicitly threatening pipeline supplies yet. Despite supermajors moving to unwind their interests in the country and a visible impact on Russia’s oil exports, there is not yet any visible drop in LNG volumes.
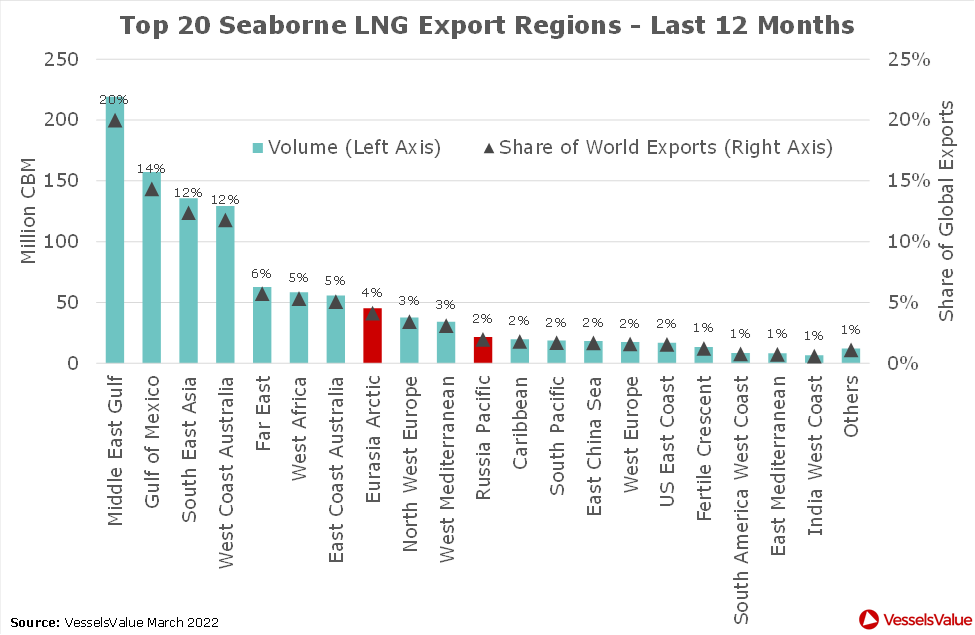
Russia’s share of the seaborne LNG market is certainly large enough to move the needle on the global supply/demand balance. Of the top 20 export regions over the last 12 months, Russia accounted for two, highlighted in red in Figure 1 below. The Eurasian Arctic contributed 4% of total volumes and the Russian Pacific another 2%. However, there are four much larger export regions, which each account for double-digit shares: the Middle East Gulf (20%), the Gulf of Mexico (14%), Southeast Asia (12%) and West Coast Australia (also 12%). Smaller changes in any of these four regions can outweigh larger changes in the two Russian regions.
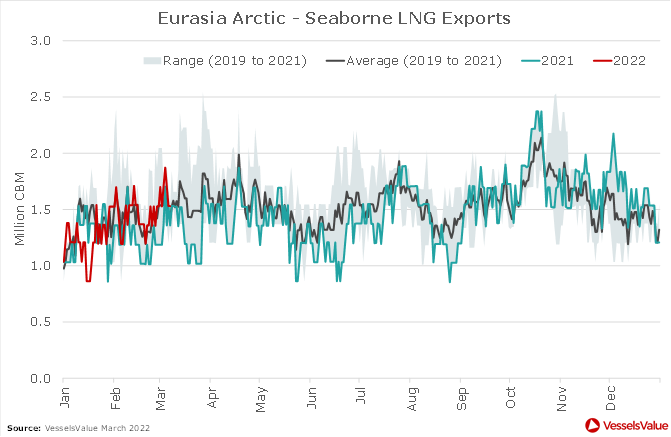
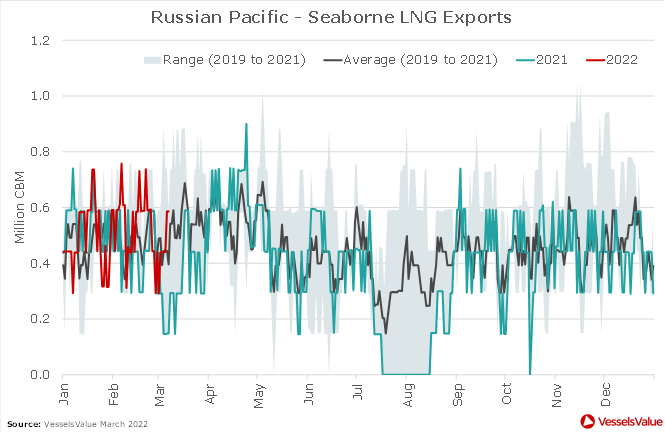
Neither of the two Russian regions are yet exhibiting any unusual drop in seaborne volumes. As shown in Figures 2 and 3, below, volumes on the water are currently trending in line with recent historical averages and last year’s levels. Compared to oil exports, which have plummeted as traders have shown almost complete unwillingness to buy Russian cargoes, this is to be expected, as oil is dominated by spot purchases, whereas LNG is dominated by long term offtake agreements. The cargoes have, in effect, already been bought. How long it takes for these exports to then find buyers willing to import them, particularly for Yamal LNG’s Westbound cargoes from the Eurasia Arctic, is another matter. But for the time being, supplies are there and, with the market so hot, they should soon clear.
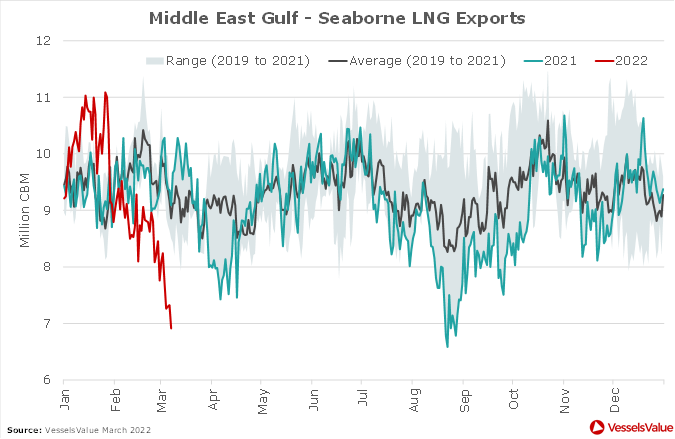
The two Russian regions together are the source of approximately 2 million CBM of LNG “on the water” every day. When looking at the top four export regions, shown in Figures 4 to 7 below, the much bigger concern becomes whether a loss of that amount from the top one can be offset by gains from the other three. Volumes from the Middle East Gulf are trending 2 million CBM per day below three-year averages and last year’s levels.
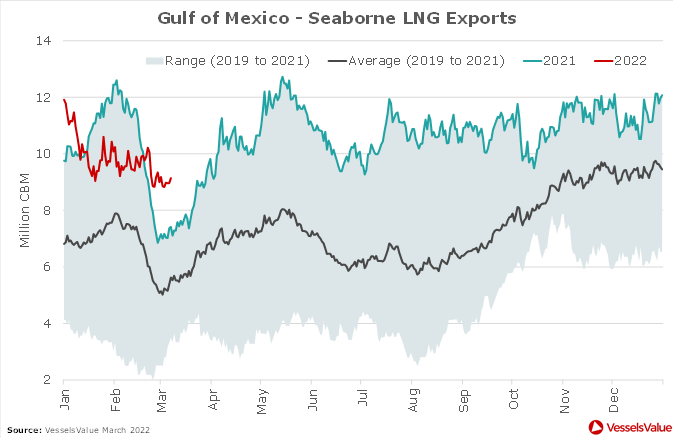
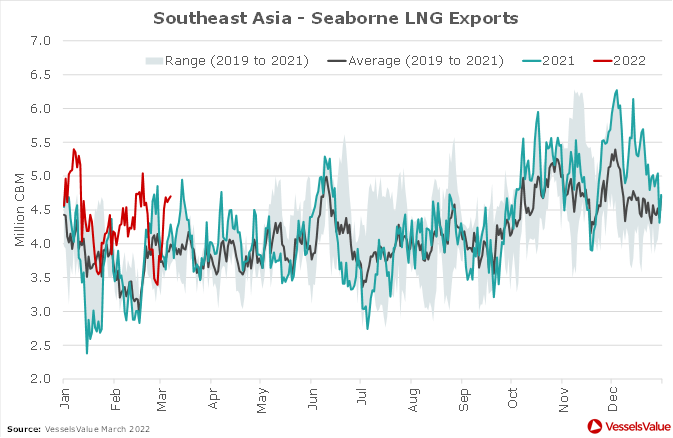
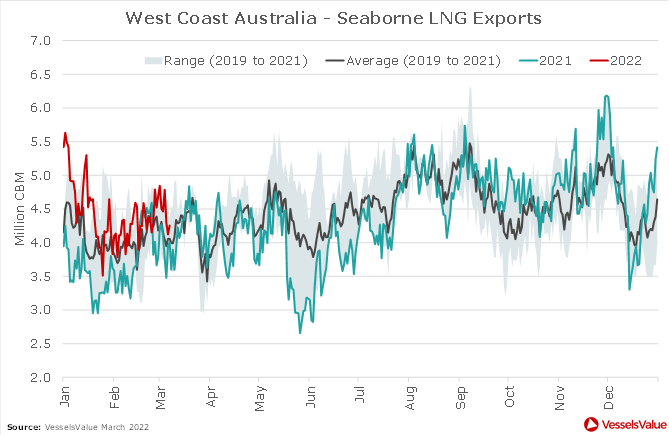
For now, it appears a 3 million CBM gain in Gulf of Mexico volumes is more than enough to offset this. The region is a relative newcomer to the market and still in ramp up mode. Furthermore, as a newcomer, less of it is shipped under long term offtake agreements and a higher proportion is traded on a spot basis, making it more sensitive to global price signals. This can also be said of the 1 million CBM gain from Southeast Asia, which includes not only major oil and gas producer Indonesia but also regional storage and trading hub Singapore. West Coast Australia, meanwhile, is broadly stable.
Volumes of these magnitudes dwarf those emanating from Russia. While the market awaits further developments on the fate of Russia’s pipeline gas exports to Europe, perhaps these early indicators from the seaborne LNG market will assuage the worst fears of those in the gas and power industry and bring prices down from current astronomical levels.
Data as of March 2022.
Disclaimer: The purpose of this blog is to provide general information and not to provide advice or guidance in relation to particular circumstances. Readers should not make decisions in reliance on any statement or opinion contained in this blog.
Want to know more about how our
data can help you assess the market?