Dude, where’s my car?
VesselsValue has just added Vehicle Carriers to the list of vessels covered by their Trade module.
“Our Vehicle Carrier trade service provides real time data on vessel demand and trade flows. It is built up from the vessel, journey and port terminal level for each day, and history to 2013. This allows our clients to get real trading data at any level of granularity to support their commercial, operational and financial decisions.” Adrian Economakis, CSO.
Demand for Vehicle Carriers is down significantly since the onset of COVID-19. This article will look at how much demand has fallen, both globally and across some of the main trades, if there are any green shoots of demand recovery for the sector, and what has happened to values of the vessels over this time.
Demand Methodology
For the analysis of demand, data will be taken from VesselsValue’s daily updated vessel specific stoppages, journey and cargo mile demand data. This essentially identifies in real time, through use of AIS vessel locations, GIS port and terminal information and proprietary behavioral algorithms, what vessels are doing when stopped (i.e. waiting, cargo operations, laid up), what journeys they are on or have completed. This vessel level data is then aggregated up to fleet level to give real time and historical metrics on cargo mile demand and trade flows. This analysis is data driven so is not prone to the potential inaccuracies and out of date nature of customs or port data.
Globally
The chart below shows the global daily updated cargo miles of the Vehicle Carrier fleet, expressed as billions of CEU (Car Equivalent Units) nautical miles. This effectively shows the total CEU capacity of sailing Vehicle Carriers on any day.
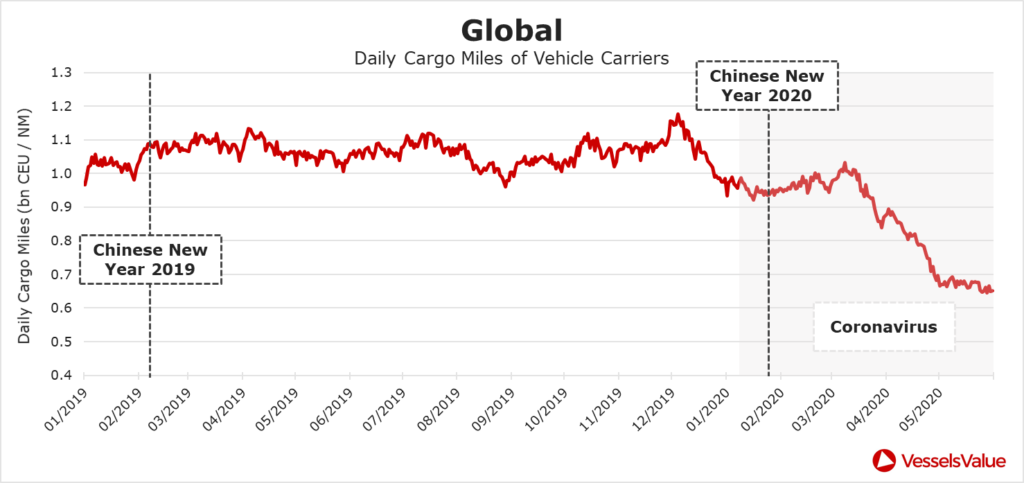
This clearly shows that there has been a double dip effect of COVID-19. There as an initial fall in the very early stages in January 20, followed by a small recovery through February and March 20, then a significant decline from the middle of March through to the present. This implies that the later lockdown on the West had a much more significant downwards effect on demand than the earlier lockdown in the East (i.e. Western car demand is a main driver of this market). Concerning, there is no evidence of a recovery with Vehicle Carrier demand remaining at multi year low levels. Other maritime sectors such as dry bulk have shown sharp V type recoveries in demand.
Another way to look at this is though the chart below which compares global CEU miles on each day so far in 2020 vs the same day in the previous year (to remove effects of seasonality).
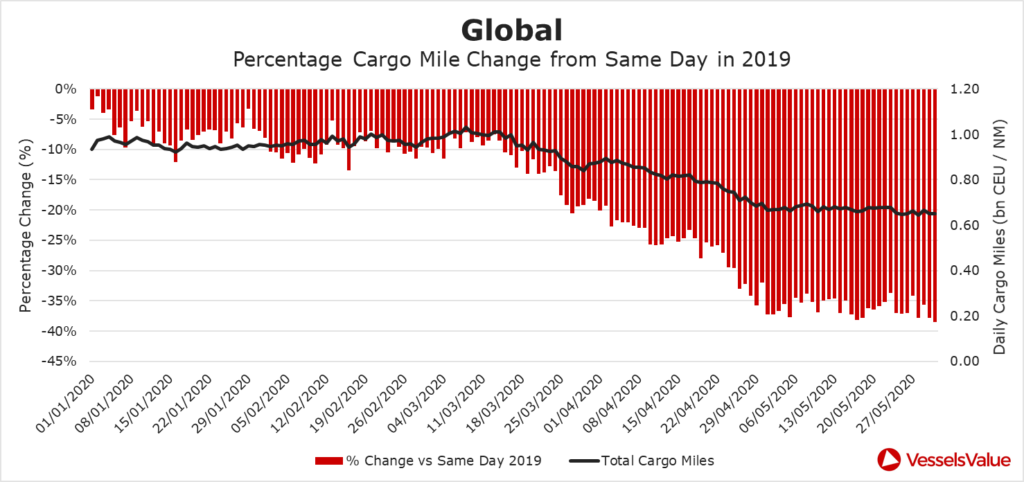
This chart shows that January 20 figures were typically 5% to 10% lower than January 2019 levels. However, figures at the end of May 2020 were almost 40% lower that same days in 2019. Comparing the whole 2020 period so far vs the same period of 2019, shows that overall CEU miles are down 18%. This data clearly signals the challenging demand environment and explains the poor market in this sector. We continue to monitor this daily for signs of demand recovery which may point to a market recovery.
Japan to Global
Japanese exports using Vehicle Carriers may give a slight reason to be optimistic. Although demand has fallen February, the last few weeks of May 20 shows the beginnings of a recovery. This recent upwards trajectory can be seen in the chart below.
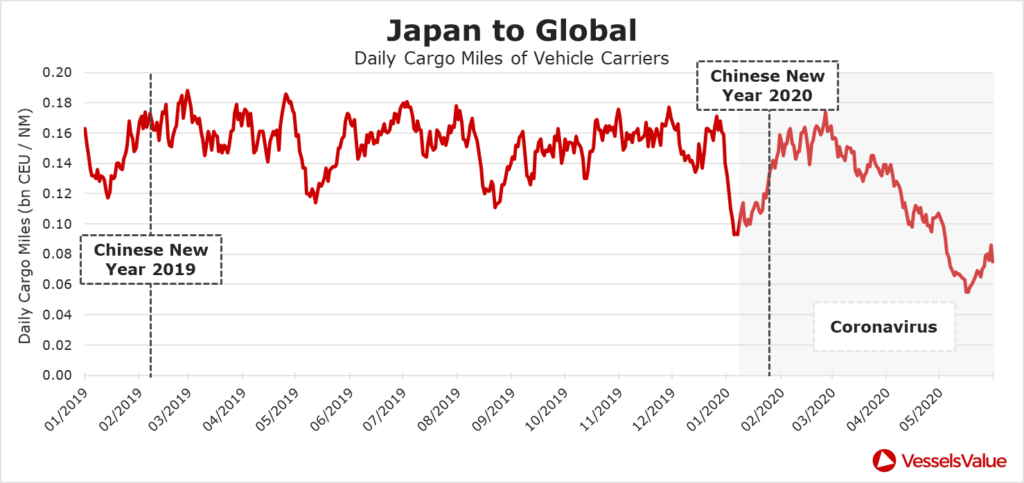
This recent upwards movement is too short to be considered a true trend but if it continues could mark the bottom of the market as of middle of May 2020.
Total CEU demand out of Japan in 2020 so far is 22% below that for the same period on 2019.
Germany to Global
The chart below shows an interesting spike up in demand through March 20, followed by a steep decline in early April 20 and then the possible beginnings of a recovery.
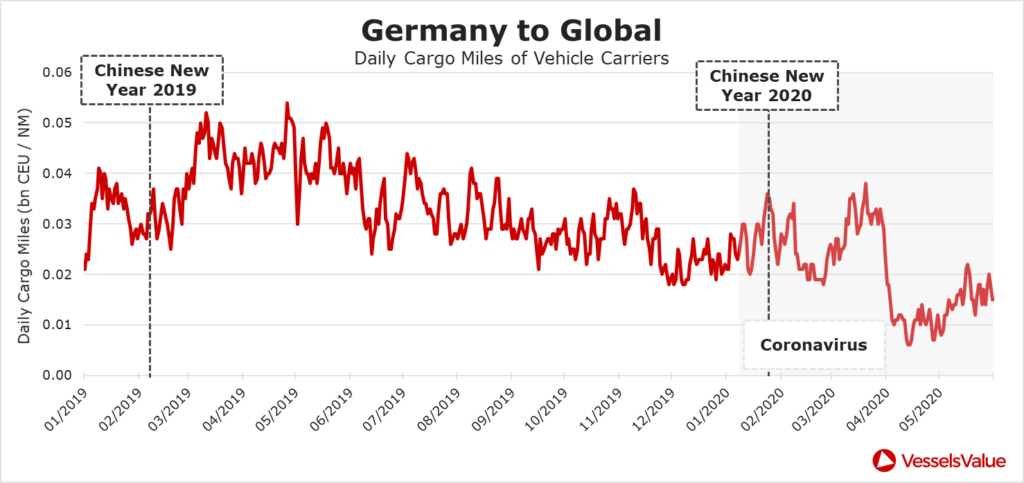
Total CEU demand out of Germany in 2020 so far is 45% below that for the same period on 2019.
USA to Global
The data here shows a gradual but continual decline in demand for Vehicle Carriers for US exports.
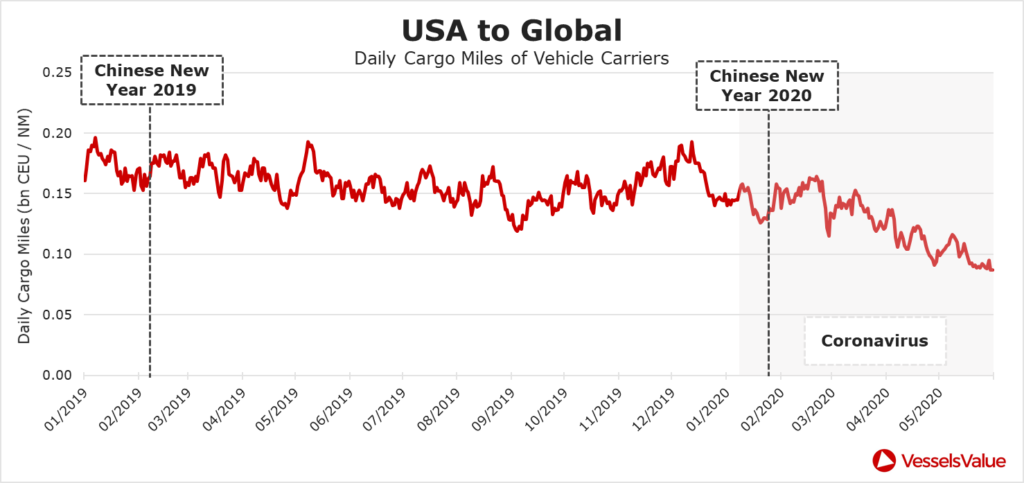
Total CEU demand out of the US in 2020 so far is 23% below that for the same period on 2019.
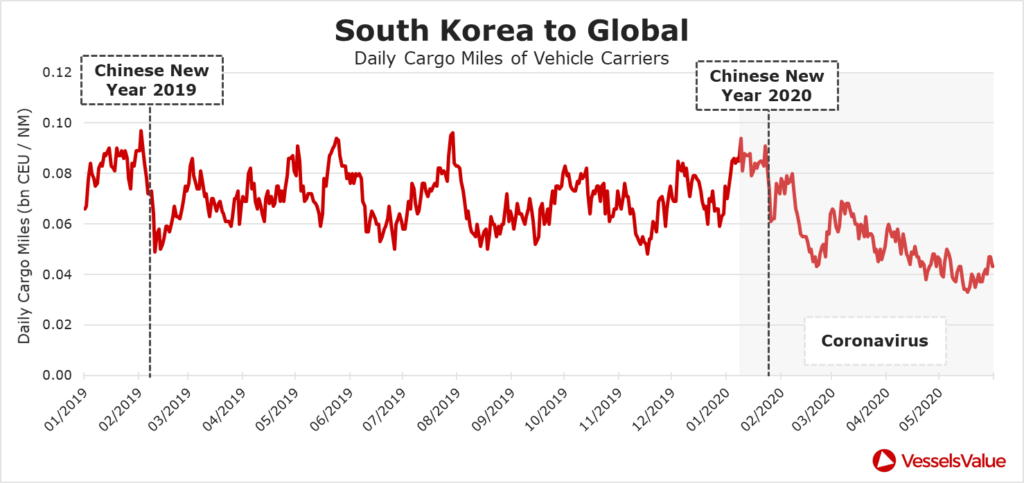
South Korea to Global
Demand out of South Korea is down 22% year on year so far, with a very small recent uptick.
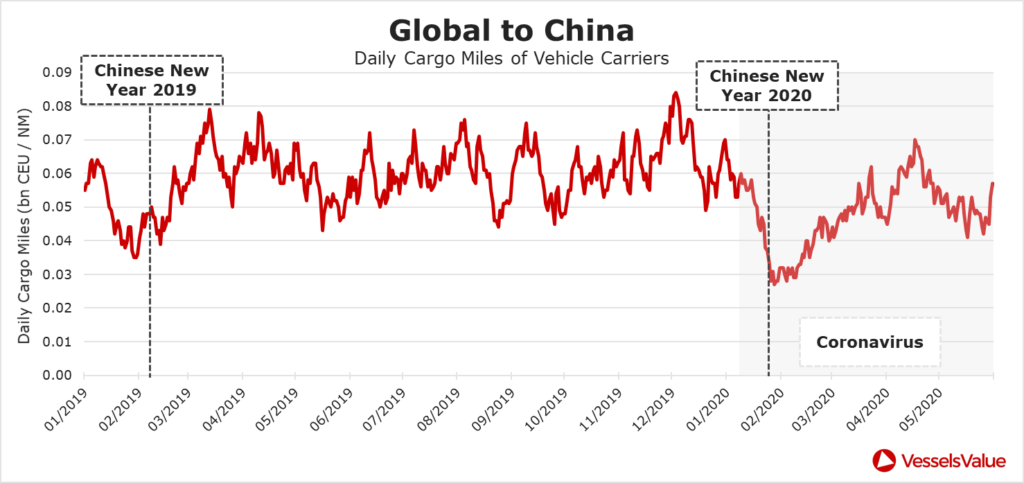
Global to China
Now switching to looking at the effect of import demand for Vehicle Carriers, starting with the global to China trade.
This shows an interesting a very different trend. Demand for importing vehicles shrank sharply in January 20 but then staged and early and rapid recovery through March and April as Chinese lockdown eased and importers tried to catch up on missed volumes. This very much is a positive sign. However, demand is still down 14% year on year so far.
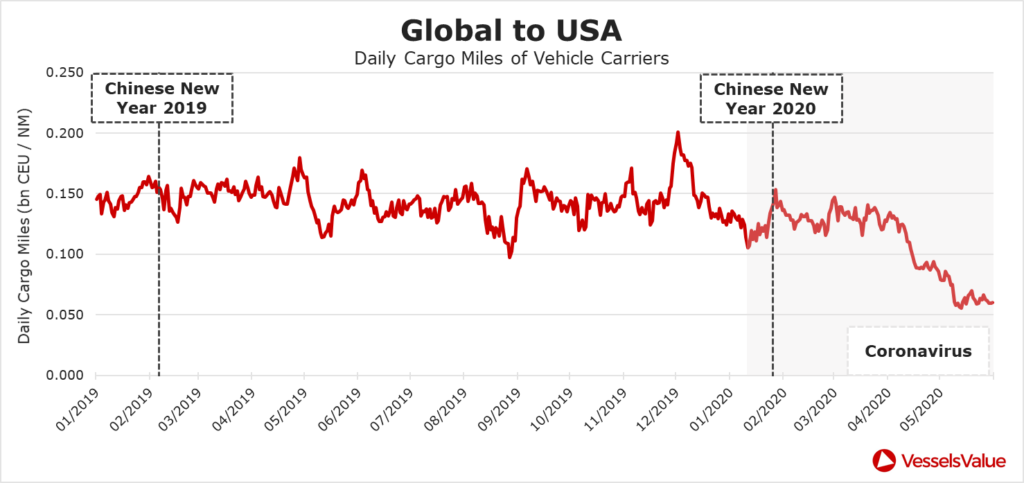
Global to USA
Demand for Vehicle Carriers coming into the US has significantly fallen over the period and showing no signs yet of a recovery. Year on year so far demand is down 24%.
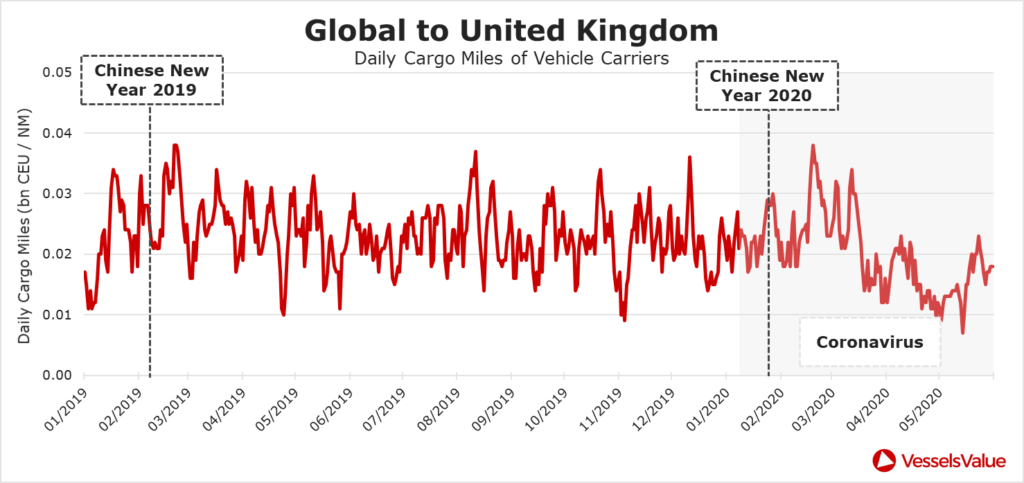
Global to UK
Demand for Vehicle Carriers coming into the UK has been volatile. Year on year so far demand is still down 15%.
Demand Summary
Demand globally is down 18% year on year so far. Some markets (Japan exports and China imports) are showing faster recovery than others (US exports and UK imports). However, there is still a long way to go to get back to pre COVID-19 demand levels, and until that happens, or there is significant increase in vessel scrapping, the Vehicle Carrier market will remain challenging.
Please contact us for a deeper dive into this, and the ability to track demand and changes to trade flows on a daily basis.
What’s happened to values and transactions?
We have seen a notable drop in asset values, with older vessels experiencing the biggest percentage falls. Since the beginning of the year, 20 year old vessels have lost over 12% of their value and modern vessels have dropped a much more reasonable 3%. The Vehicle Carrier market is typically less liquid and volatile than the main shipping sectors, so historically these moves are quite significant.
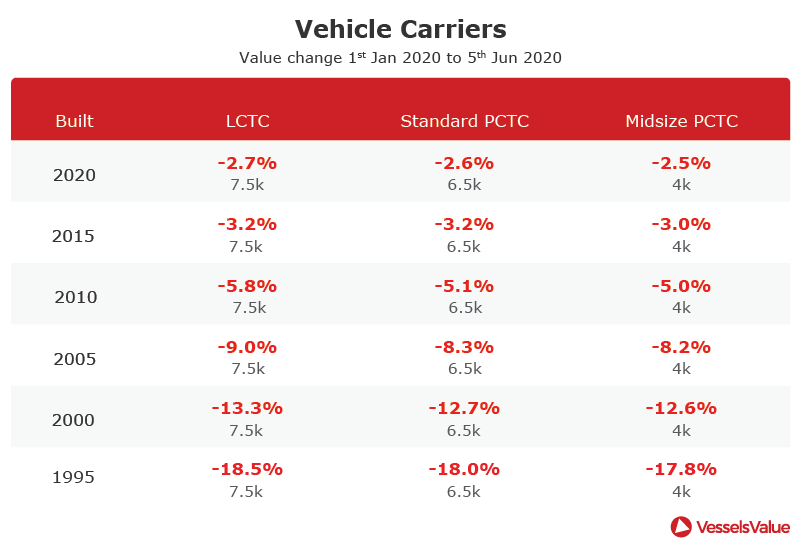
The table above shows the percentage fall in Vehicle Carrier values for each ship type and their corresponding size.
Sales
A 75% finished hull built at 3 Maj Brodogradiliste is being auctioned off however we suspect there will be no takers of this vessel during the COVID-19 outbreak. Siem Car carriers ordered her in 2015 for a price of USD 55 mil, however the yard did not finish her on time and Siem were able to walk away from the order.
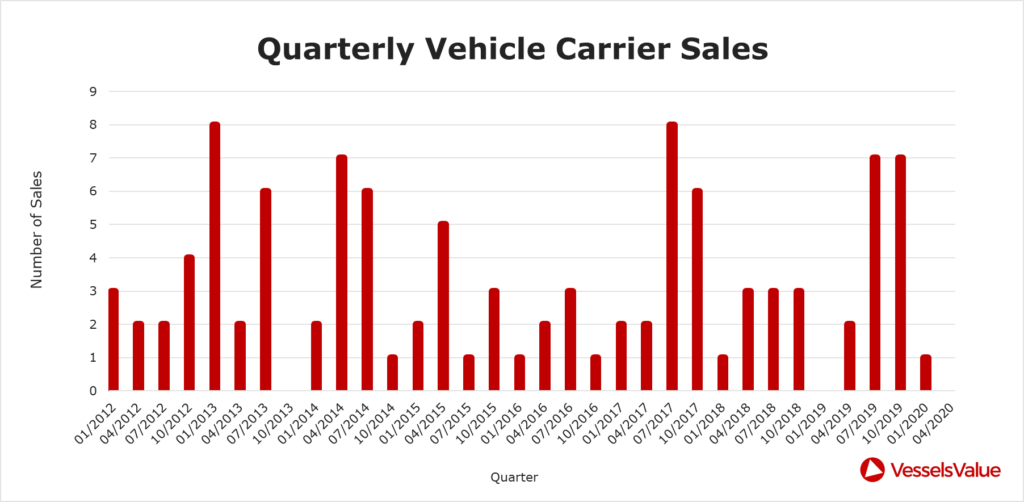
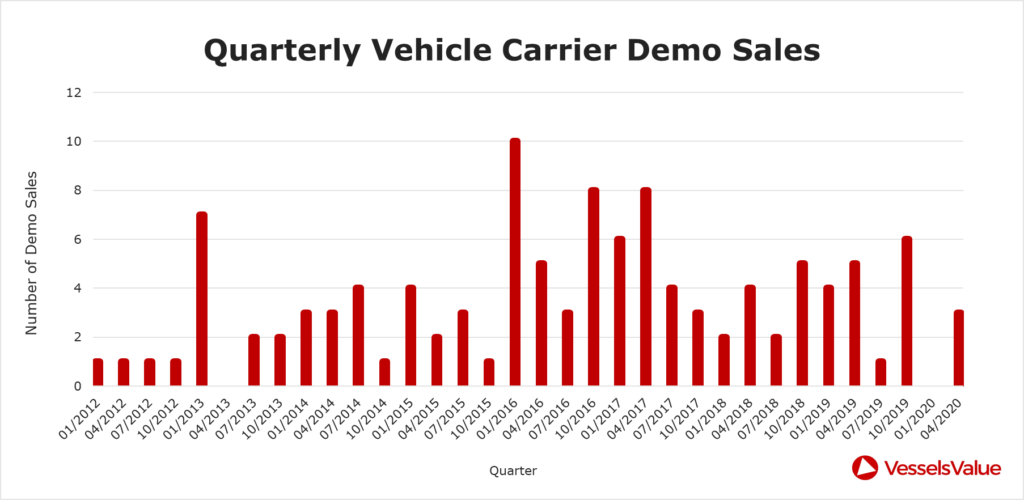
The chart below shows the number of Vehicle Carrier deals confirmed quarterly since 2012, historically there has been a steady number of Vehicle Carriers sold on the market up until this year.
Demolition
Shipbreaking yards are just starting to ease beaching restrictions and we expect to see a number of the older smaller PCCs sold for demolition in the coming months in an effort to replace the underlying supply and demand fundamentals that are driving the market.
Both NYK and MOL have been active in demolition. The latter having sold PCTC Cougar Ace 6,500 ceu blt 1993 for usd 302/ldt for breaking into India. We expect to see other Vehicle Carrier owners follow this trend in the coming weeks. The chart below shows the number of Vehicle Carrier demolition sales by quarter.
Value summary
Older vessel values have suffered the most as they have less years of remaining life to benefit from the recovery when it happens. Modern values have been relatively resilient. However, if demand remains low we values to continue their decline. Improvements will only come with a recovery in demand and/or significantly increased demolition, both things VesselsValue tracks daily and can help find possible inflection points or buyers, seller, charterers, lenders and investors.
Disclaimer: The purpose of this blog is to provide general information and not to provide advice or guidance in relation to particular circumstances. Readers should not make decisions in reliance on any statement or opinion contained in this blog.
Want to know more about how our
data can help you assess the market?