
Half year review: Trade 1H 2023
Introduction
The strength of the Chinese economy and sanctions imposed on Russian oil have been key factors in determining demand trends for LPG, Bulker and Crude Tanker markets in 2023. Using VesselsValue AIS derived indicators and Trade data such as cargo volumes, cargo mile growth, speeds, and trading routes, this half year review will provide insights into the LPG, Bulker and Crude Tanker markets in 2023 so far.
LPG
Demand and Supply
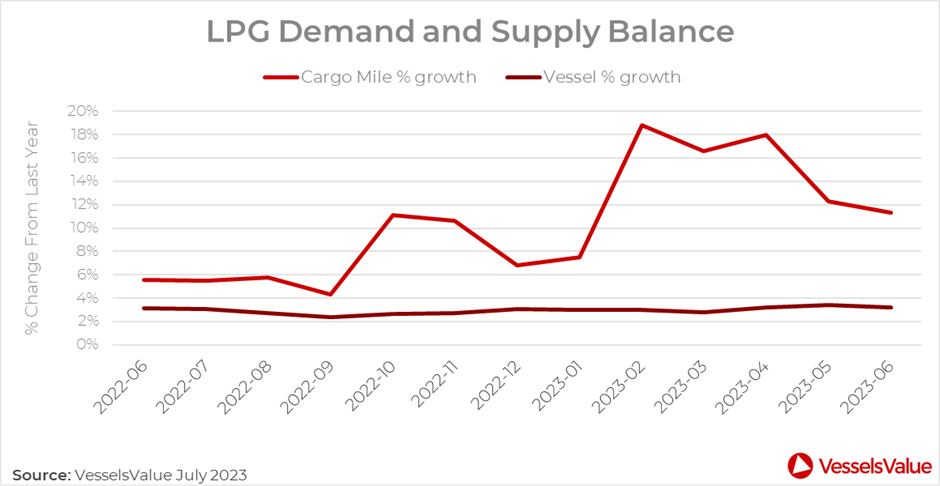
LPG seaborn Trade has seen significant demand growth, outstripping supply in the first 6 months of 2023. Figure 1 shows the YoY percentage change for LPG cargo miles (demand) and live vessels (supply). Demand growth soared in January, reaching over 18%, versus a steady 3% for supply growth. Despite this significant peak in January, LPG cargo mile growth has since followed a downward trajectory into the second quarter of 2023, as the gap closes between demand and supply.
The trend of narrowing supply and demand growth has been especially prominent in the VLGC sector in the second quarter of 2023 (see Figure 2), where the gap closed to just 1.6%.
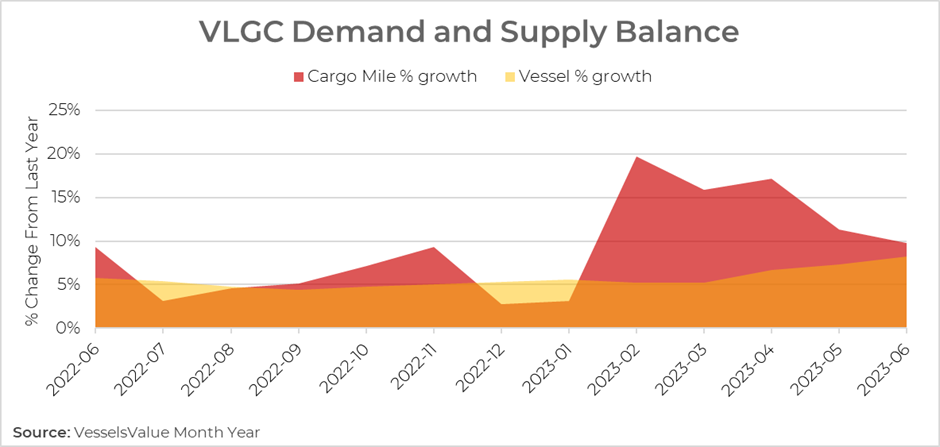
Supply growth has been rising since February and alongside a high number of deliveries expected in 2023, this could impact VLGC rates into the second half of the year, especially if demand continues to weaken.
VLGC Exports and Trade Routes
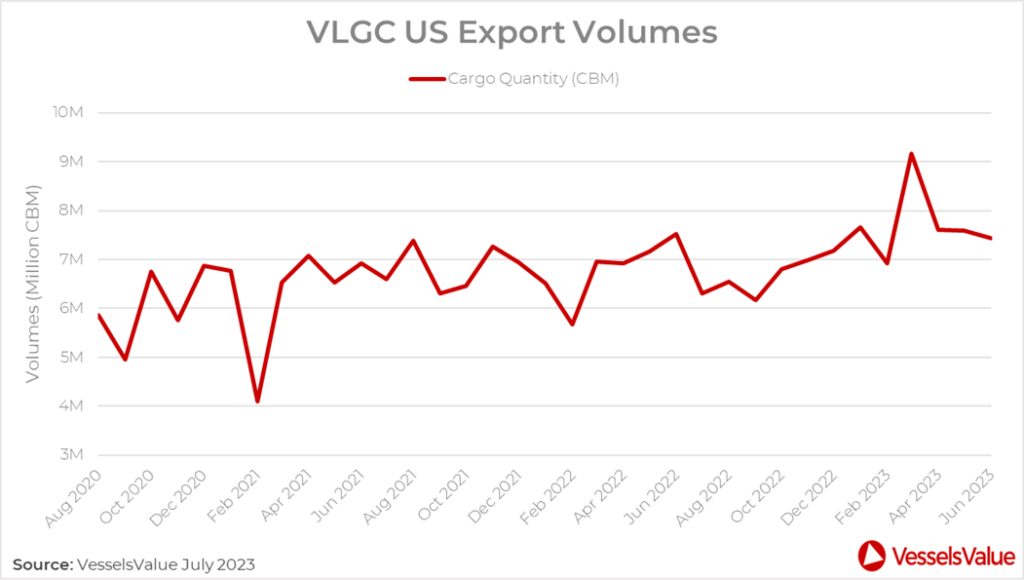
Long-haul volumes out of the US continue to be the main driver for VLGC trades and the demand growth seen at the start of the year. As US natural gas output has been increasing over the past 10 years, LPG exports from the country have risen, reaching record highs in the first half of 2023 (see Figure 3.). Volumes leaving the US exceeded 9 million CBM in March 2023, which was a 32% increase compared to the same period in 2022.
US to China remains the most influential trade route, with demand from the Chinese petrochemical sector supporting most imports, followed by imports into other Asian countries such as Japan and South Korea (see Figure 4.). Despite a 20% decline in VLGC US exports since March, volumes are not expected to fall so significantly in the second half of the year, especially with additional European LPG demand due to the Russian war in Ukraine.

Bulkers
Demand and Supply
Demand growth has stayed positive so far in 2023 for the Bulker sector, as cargo miles have grown YoY by an average of 7% since January, compared to a stable 2.9% on the supply side (see Figure 5.).
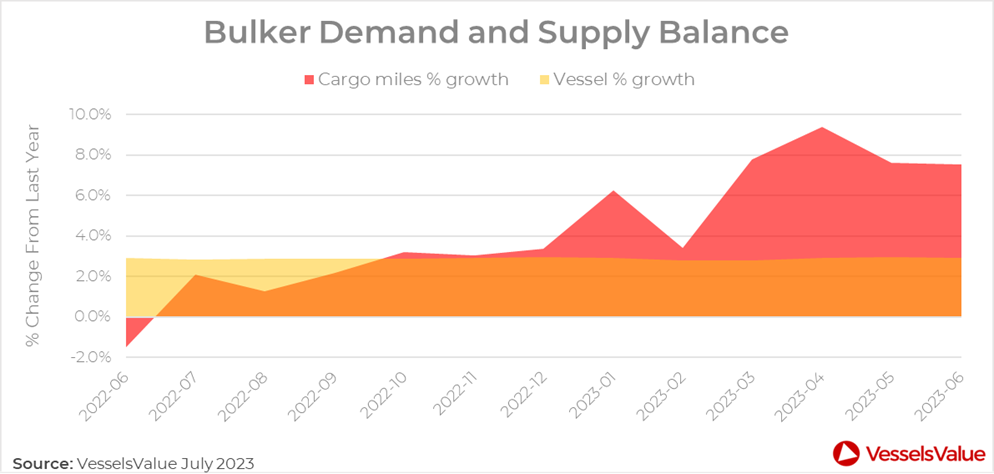
After some volatility in growth between December 2022 and February 2023, cargo mile growth rebounded between February and March this year as China’s manufacturing and demand for raw materials ramped up, with Capesize iron ore trades driving rates.
Despite demand growth looking strong for the Bulker sector in 2023 YTD, since peaking in April, cargo mile growth has followed a slight downwards trajectory into June. This correlates with more recent reports of China’s economy weakening, as a decline in steel production reduces demand for iron ore. Chinese policies introduced for stabilizing economic growth are likely to help maintain positive demand growth into the second half of the year, but there could be a delayed impact on iron ore and coal flows towards the end of 2023.
Capesize and Panamax Imports
Figure 6 shows imports into China for Capesize and Panamax vessels, two of the main ship types that carry iron ore.
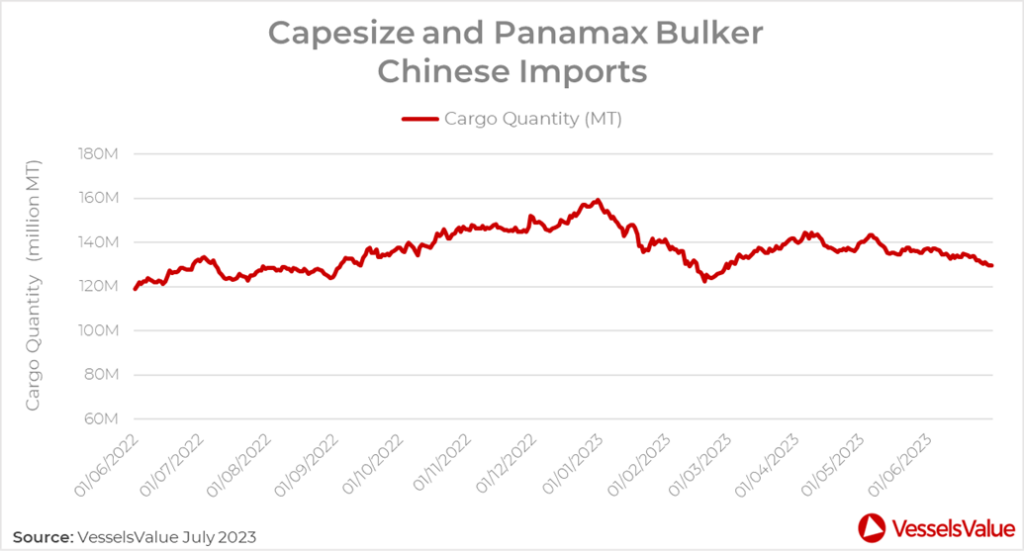
After a volatile first quarter where imports fell by almost 10%, imports picked up again into April, correlating with trends seen in cargo mile growth. From late May, imports have followed a gradual downwards trajectory. Alongside a reduction in Chinese imports from May, Capesize and Panamax average laden speeds fell to 10.96 knots in June 2023, a notable decrease after laden speeds spent the first 5 months of the year rising and recovering from lows recorded in January. A reduction in Chinese import volumes and speeds is suggestive of reduced demand for iron ore, likely due to lower margins in steel production caused by high iron ore prices and hints of Chinese economic fragility.
Capesize and Panamax Trade Routes
Capesize and Panamax sectors have been underpinned by exports from Australia and Brazil. Despite a more recent decline in demand, Australian and Brazilian exports are a combined 8% higher this YTD versus the first 6 months of 2022, reaching 608 million MT and 257 million MT, respectively. Brazilian demand showed the most growth, with Jan-June 2023 cargo miles and volumes both increasing by 6% YoY, an indicator that overall demand this year has been positive for these ship types. As mentioned above, we may see growth weaken into the second half of 2023 if there is a delayed impact on iron ore and coal markets.
Crude Tankers
Cargo Miles and Speeds
The first half of 2023 has looked positive for demand in the Crude Tanker market, with consumption of oil increasing as resurgence in travel continues, teamed up with a limited tanker orderbook. Sanctions imposed on Russian oil in December 2022 were pivotal as we entered 2023, followed closely by sanctions imposed on Russian petroleum products in February 2023. These sanctions caused global trading routes to change, leading to increased speeds, cargo miles and a tightening of available vessels, all things supporting the Crude Tanker markets in the first half of 2023.
Crude Tanker cargo miles have consistently stayed above levels seen in the third quarter of 2022, see Figure 7.
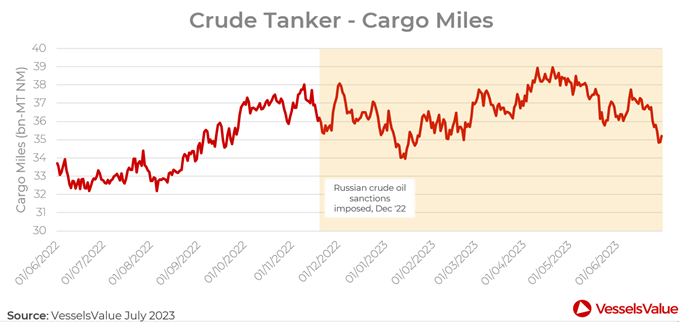
A temporary decline in global cargo miles happened after Russian crude sanctions were initially imposed in December 2022, where cargo miles fell from around 38 bn-MT NM in December to 34 bn-MT NM in January. However, cargo miles picked up again into April as trading patterns began to evolve and adapt to the newly imposed sanctions. This suggests that despite the sanctions, Russian crude continues to be traded, but trade routes have shifted. More recently in June, cargo miles have followed a downwards trajectory, which could be indicative of a weakening Chinese economy and crude oil demand, especially for larger Tankers, such as VLCCs from US-China. Vessel speed can be used as another demand indicator, as vessels will often speed up in a good market to fulfil demand, especially if there is slower growth in vessel supply. Alongside growth in cargo miles, the first 6 months of 2023 has seen an increase in Crude Tanker speeds vs. the first 6 months of 2022, see Figure 8.
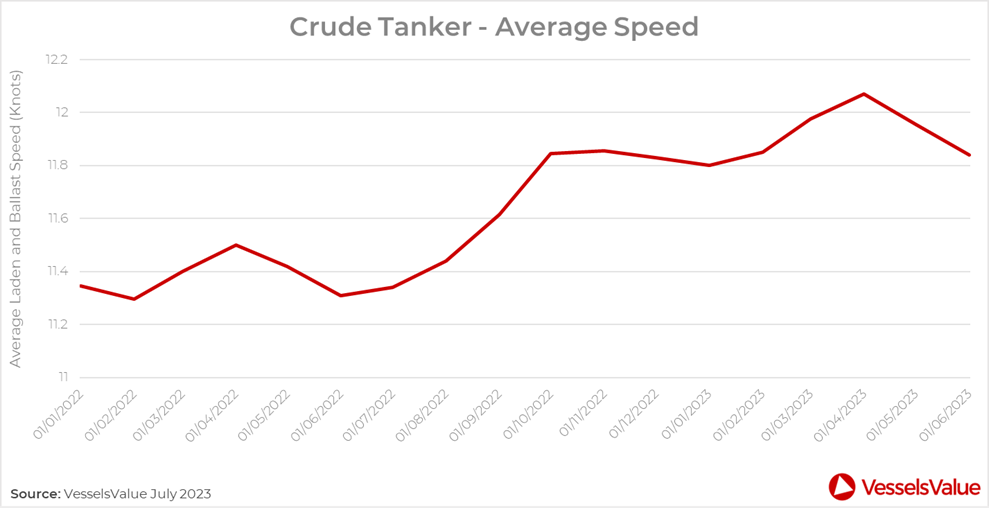
Crude Tanker average speeds increased by nearly 5% between June 2022 and December 2022 and a further 2% increase between January and April. These speed increases correlate with growth in cargo miles, peaking in April. Since April, cargo miles and speeds have decreased, hinting at a reduction in demand in the second quarter of 2023. Increasing environmental regulation (EEXI/CII) could also be prompting this decrease in speeds which we could see continue as rules tighten.
Changing Trade Routes
The sanctions imposed on Russian crude oil have played a significant role in changing global trade patterns and shaping the Tanker markets in the first half of 2023. Some Russian crude exports which used to travel short-haul distances are now forced to travel long-haul distances and some ex-importers of Russian crude are now forced to use further afield export locations.
Comparing Russian Crude Tanker trade flow pairings in the first half of 2022 and 2023 is insightful in showing how the sanctions have had a distinct impact on import destinations changing. See Figure 9 for the top 5 import destinations in 2022 and 2023.
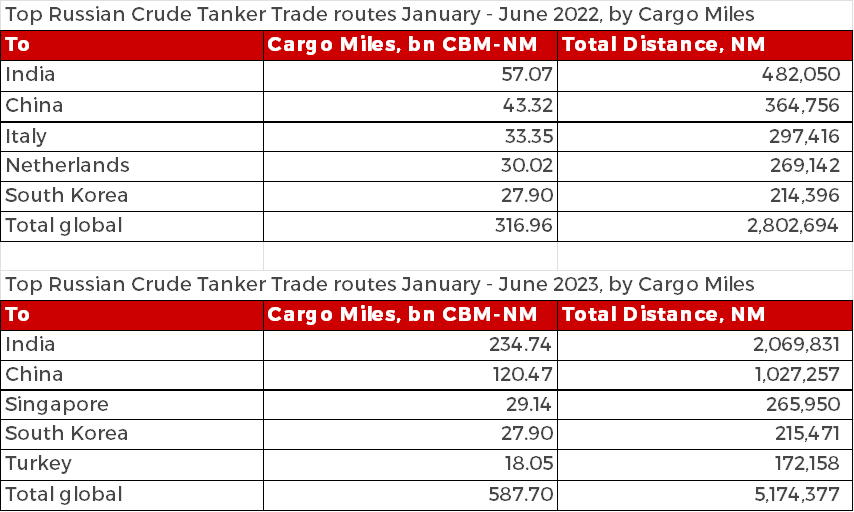
Overall, when comparing the first 6 months of 2022 and 2023, Crude Tanker cargo miles and distances have increased by 85%, which is a significant increase that will be contributing to the tightening of vessel supply in the market. These trends suggest that Russia is exporting similar levels of crude oil but they are exporting it further afield. Looking at specific routes, the top importers by cargo miles remain as India and China, with India’s share of total cargo miles from Russia over doubling YoY from 18% in the first half of 2022 to nearly 40% in the first half of 2023. This correlates with India increasing its production of clean oil products.
Aside from these countries continuing to accept Russian crude, European countries such as Italy, Netherlands and France have disappeared off the top trade pairings, sourcing oil from further afar locations, such as the US. Whilst sanctions are expected to remain for the foreseeable future, supporting some longer hauls, a more recent weakening Chinese economy and extended OPEC cuts could see a continued reduction in crude oil Tanker demand into the second half of 2023.
Conclusion
Signs of strengthening demand were evident across the LPG, Bulker and Crude Tanker sectors in the first half of 2023. LPG demand growth in the first half of 2023 started strongly, especially in the VLGC market, peaking in the first quarter of 2023. However, supply growth is catching up as new vessel deliveries infiltrate the market, increasing capacity on the water which could see rates decrease as the year continues.
The Bulker market, supported by China’s demand for raw materials, has seen positive demand growth overall in 2023 so far, although demand growth and cargo volumes did decline into the second quarter. This sector could see a more pronounced weakening in demand depending on the success of China’s economic stabilisation plans.
Crude Tankers have seen a shift in trading patterns this year, primarily due to sanctions imposed on Russian oil, which mean cargoes are travelling longer distances and reducing available capacity on the water. With sanctions unlikely to disappear anytime soon, it is possible that this longer-haul trend will continue well into the second half of this year and 2024.
All three sectors had a vibrant start to the year which saw increased demand, but towards the end of the second quarter, we saw demand growth stabilise or recede in some areas.
VesselsValue data as of July 2023.
Disclaimer: The purpose of this blog is to provide general information and not to provide advice or guidance in relation to particular circumstances. Readers should not make decisions in reliance on any statement or opinion contained in this blog.
Want to know more about how our
data can help you assess the market?