
Half Year Round Up – Trade
So far, 2020 has been an unsettling and volatile year for the shipping industry as a whole, particularly related to the effects of the COVID-19 pandemic. Very early on, 2020 was looking to be a positive year for many routes and sectors, but this was short lived as COVID-19 quickly disrupted the global supply chain. Inevitable reductions in demand across all sectors, caused by many countries imposing strict lockdown restrictions, resulted in a significant deterioration in global trading overall. This reduction in demand, coupled with long port delays, operational challenges, and rate reductions, caused many trading routes to falter and some came to a complete standstill.
These factors are shown to have been most pressing for the Container and Vehicle Carrier markets, but not all sectors have been challenged in the same way. Shortly after the onset of COVID-19, the Tanker market thrived as a result of geopolitical pressures on global oil markets, and the Bulker market felt the impacts of COVID-19 more temporarily, making a promising recovery.
The VesselsValue Trade platform allows us to explore trends in global trade flows, measuring demand for vessels through analysis of derived satellite and terrestrial AIS vessel location information. This data allows us to track trends in daily, weekly or monthly demand, looking at cargo miles over time to form an objective view on how the past 6 months have panned out for different sectors.
Bulkers
It has been a turbulent start to the year for Bulkers, as the initial impacts of COVID-19 sent demand plummeting. However, this was short-lived as demand quickly recovered and surpassed levels seen in 2019. The chart below shows global daily cargo miles for all Bulkers, ranging from Capesize to Handy Bulker.
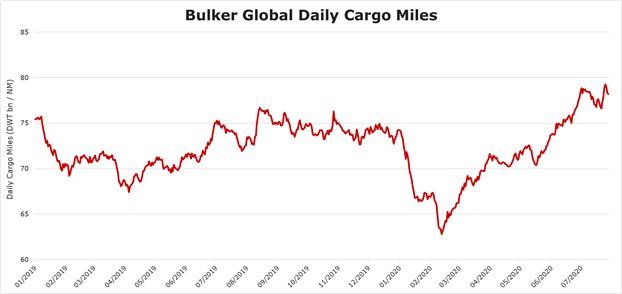
This shows that Bulkers had a strong last half of 2019, with daily cargo miles keeping stable at c.75 billion NM, up until the beginning of January, when cargo miles declined rapidly by around 22% to c.60 billion NM. This drop in demand to a historical low synchronised with falling Bulker earnings at the time across some sectors. For example, Capesize earnings began to fall in December 2019 and did not begin to improve again until March 2020, when demand began to pick up again. Bulker demand was quick to play catch up from March onwards, with earnings following suit, rising confidently from the beginning of May for most Bulker sectors.
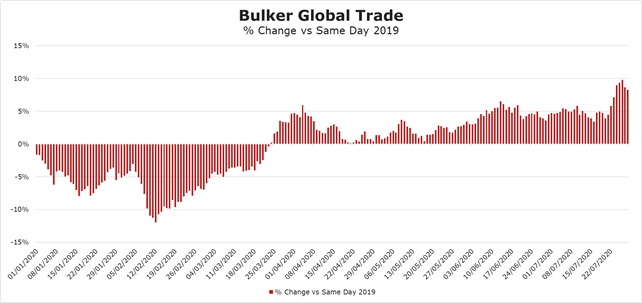
The negative impact of COVID-19 on cargo miles this year, up until the end of March, becomes obvious when looking at percentage change for Bulkers. An annual reduction in cargo miles in January is expected due to Chinese New Year, but this negative trend continued to run for the next three months as the global pandemic had an initial impact on China. China was quick to react to the crisis and impose lockdowns, but as a result, industries such as steel production and manufacturing were also halted for the foreseeable future, limiting imports of raw materials such as iron ore and coal. The largest negative percentage change in cargo miles was seen at -12% in mid-February, when compared to the same time period in 2019. From then, cargo miles began to gradually improve again and have been ever since, and we are now remarkably seeing daily cargo miles for Bulkers exceed levels in 2019. China’s swift efforts to get production started again means the Bulker sector has made a successful recovery despite the potential for the sector to be one of the most volatile. The market’s ability to improve and overcompensate for lost time means despite a volatile first few months of the year, the outlook is positive for Bulkers.
Tankers
All eyes have been on the Tanker market, which has had an even more eventful start to the year, with Tanker rates reaching historical highs in April. Despite COVID-19, the Tanker market has spent the majority of 2020 in a very positive position. Events leading up to April saw an oil price crash and oversupply of crude, resulting in a contango market with traders locking in oil at low prices to sell at a profit. During this period, VLCC rates reached a staggering 264,000 USD per day, Suezmax peaked at 127,000 USD per day and MRs at 87,000 USD per day.
Such a large oil surplus was coupled with a cut in demand due to COVID-19 and a steadily declining onshore storage capacity, resulting in record numbers of both clean and dirty Tankers engaging in floating storage.
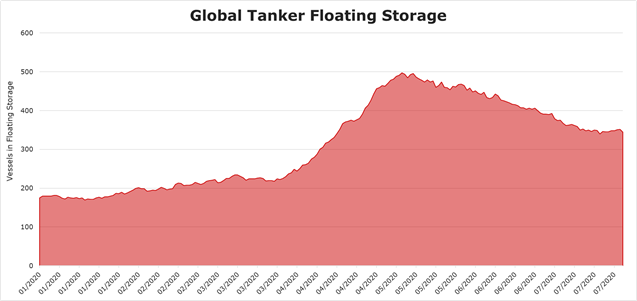
The chart above shows a dramatic increase in vessels being used as floating storage in 2020, with numbers more than doubling between April and May. Since the end of May, floating storage figures are beginning to unwind again, as tanker earnings stabilise, and refiners begin to increase throughput as demand increases.
Dirty Tankers
The volatility of the Tanker market is demonstrated by the YoY daily cargo miles chart below. As you can see, Dirty Tankers (including VLCC, Aframax and Suezmax) have reached much higher cargo mile levels this year so far than in the first half of 2019.
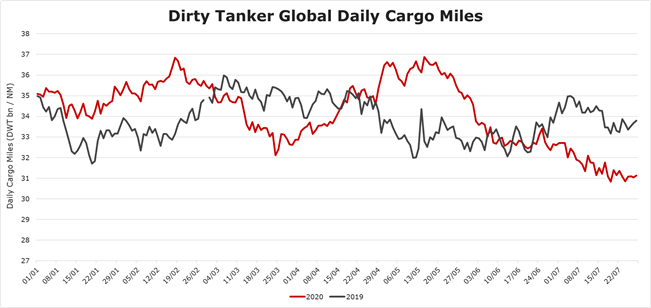
2020 had a healthier start than 2019, with a 7.1% percentage change in cargo miles versus the same day in 2019. By February, there had been an impressive 11% increase compared to 2019.
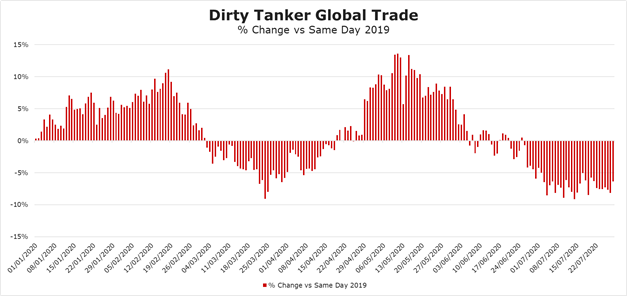
Unsurprisingly, by late February, this strong start began to weaken, as total cargo miles quickly fell 14% from 37 billion NM to a low of 32 billion NM in mid-March. This suggests that early on, the Tanker market did indeed feel the impacts of COVID-19. However, the market soon recovered after OPEC+ countries failed to reach an agreement over production cuts to retain stable oil prices in March. A significant oversupply of oil sent rates soaring as traders took advantage of plummeting oil prices.
By late April, cargo miles surpassed 2019 figures and continued to increase into May. May saw high cargo miles stabilise, whilst at the same time, floating storage numbers peaked, remaining remarkably high throughout June. This floating storage trend correlates with what we see happen to cargo miles towards the end of May, as they decline into June. Vessels for the most part will remain stationary when engaging in floating storage, thus not accumulating a distance travelled, which is why we see a reduction in cargo miles during this period.
Clean Tankers
Overall this year, cargo miles have stayed closer to figures seen in 2019 when comparing to Dirty Tankers, suggesting less volatility in the sector. However, cargo mile highs were seen slightly earlier on in the Clean Tanker fleet this year (including MR1s to LR3s).
The chart above shows that cargo mile demand dropped sharply after Christmas, due to the normal lull of Chinese New Year, exaggerated by US Gulf refinery maintenance and the early impacts of COVID-19. Levels stooped to a low of 11 billion NM in February, reaching a negative percentage change of 6% versus the same time in 2019. By the end of February, Clean Tanker cargo miles had begun to recover and increase into March. By very early on in April, a positive percentage change of 9% was seen versus the same period last year, as cargo miles sharply rose to nearly 13 billion NM.
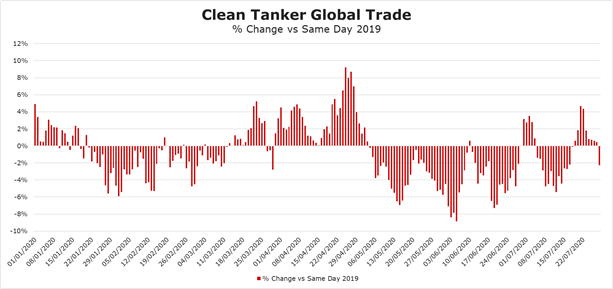
Despite a brief drop in mid-April, by the end of the month, cargo miles had again risen, this time reaching a notable 9% increase on last year. The same high rates were seen in the Clean Tanker market, allowing the sector to remain profitable despite other sectors taking a real knock from the ongoing global pandemic.
Containers
In the following data, we have focussed on Handy Containers up to ULCV. Containership cargo miles were amongst the hardest hit by the impacts of COVID-19, compared to other sectors. Between late February and mid-March, cargo miles remained consistently low at around 4.6 billion NM. At the end of March, things were looking up as cargo miles started to rise again.
This correlated with the initial effects of COVID-19, as the early outbreak in China led to rapid lockdowns and skeleton workforces implemented in manufacturing hubs and ports. The rapid measures that China, a significant Container exporter, put in place to slow down the pandemic and start up operations again, was one of the reasons that cargo miles began to recover in the first few months of the year.
However, Containerships were again impacted significantly, as COVID-19 began to spread globally, and other countries started imposing strict lockdowns. This meant consumer demand plummeted across countries such as the US and many parts of Europe, resulting in record numbers of Containerships sitting idle. Since June, cargo miles have continued to recover as more and more countries ease lockdown rules and demand begins to stabilise.
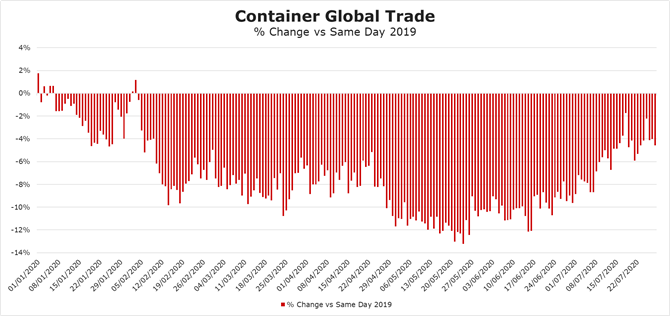
Cargo miles have been consistently lower than 2019 throughout the last 6 months, although the percentage change is beginning to lessen as cargo miles recover. This is a good sign for Containerships, although there is a still a way to go before 2019 figures are matched.
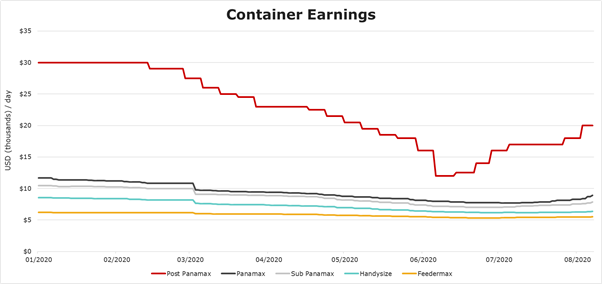
Demand recovery since June has been matched with recent improvements in Containership earnings, which had previously experienced rate declines across the board since around mid-February. Despite very slight increases in smaller types, Post Panamax rates have started to head in the right direction, reaching $20,000 USD per day in August.
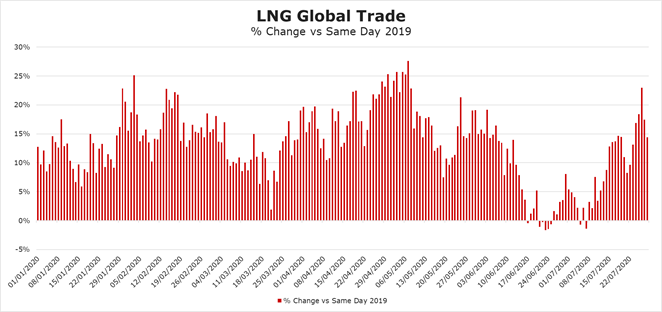
LNG
So far this year, LNG cargo miles demonstrate that demand has stayed above 2019 levels, despite an expected decline at the end of February, as LNG demand deteriorated across key Asian import markets. A further decline was seen in May, likely the result of COVID-19 disruptions in the US affecting export numbers. Cargo miles more recently look set to continue to rise close to pre-COVID-19 levels, suggesting that recovery may be on the horizon, hopefully boosted by heading into winter months.
COVID-19 effects certainly resulted in a dip in LNG exports, as well as field exploration, but cargo miles only dipped lower than 2019 for eight days in total this year. For the majority of 2020, positive growth is seen when comparing year on year, which is a good sign for LNG considering circumstances.
Vehicle Carriers
The Vehicle Carrier market has been hit hard by the effects of COVID-19 this year, as many of the major trading routes from the East came to a complete halt. Global demand for cars at the height of the pandemic was slashed significantly, and many ports struggled to clear the throughput in order to receive new stock.
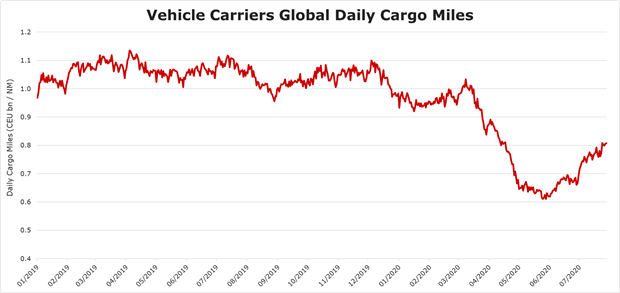
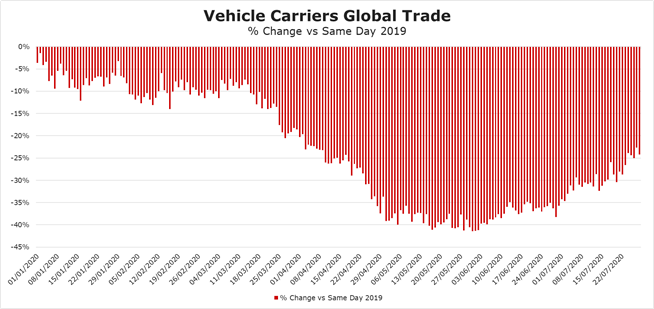
Since the beginning of March, cargo miles have endured a significant and prolonged decline and did not begin to pick up again until very early in June. The negative impact on the market is also reinforced looking at the percentage change graph. Comparing cargo miles across both years highlights that levels have been consistently lower this year, at points dropping by a staggering 40% when compared to last year.
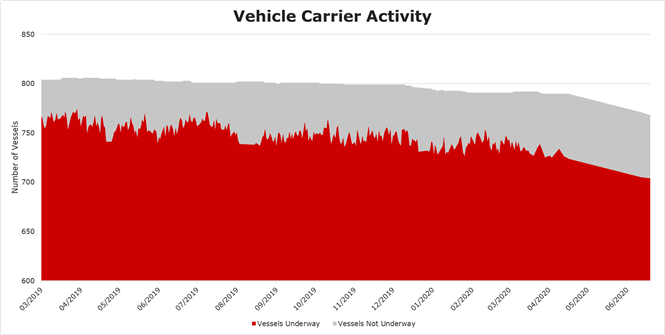
Cuts in car manufacturing as well as little to no demand caused many vessels to become inactive. The below chart shows how the count of stationary vessels not underway increased across 2020, with the vessel count reaching a high of 103 in early May, equating to 13% of the active fleet.
What might be in store for the remaining half of 2020 and how will this shape shipping markets in the future?
It is safe to say that 2020 has proven to be an uncertain year for all shipping sectors. Whether a sector has suffered losses, growth or shown signs of strong recovery, global economic situations mean that all sectors in one way or another have experienced volatility. As many countries have now started to ease lockdowns in both eastern and western hemispheres and with many trading routes beginning to return to normal, there is hope that the recovery seen in some sectors will continue on the basis that the COVID-19 continues to be managed.
One thing that is certain is that the shipping industry will continue to evolve as a result of this pandemic, investing in innovative technology and tools to improve the resilience of the industry and overcome the operational challenges that have been experienced so far this year. However, ultimately, all sectors rely on one driving factor to remain successful, and that is demand. The following 6 months outlook for shipping will be determined heavily on global demand and economic stability improving, so is not yet completely clear how some of these sectors will finish off the year.
Disclaimer: The purpose of this blog is to provide general information and not to provide advice or guidance in relation to particular circumstances. Readers should not make decisions in reliance on any statement or opinion contained in this blog.
Want to know more about how our
data can help you assess the market?