
Small Dry: Demand bolstered by strong Container and Dry Bulk earnings
VesselsValue Trade data has been used to analyse current and historical demand in the Small Dry space. Demand indicators such as cargo miles, journey counts and speeds are derived from AIS through applying algorithms to the data, in order to see recent trends in the sector. This article will take a closer look at these trends and other market influences.
Small Dry bolstered by strong Container and Dry Bulk earnings
Small Dry, General Cargo and Multipurpose vessels below 40,000 DWT are renowned for their flexibility, able to handle a wide variety of cargoes ranging from breakbulk and wind farm components, yachts to heavy lift projects. The demand for transport of these commodities rebounded to normal levels before further increasing, as previously a lot of cargo had been stuck in ports or storage with operations having slowed down due to the pandemic. Gradually market participants adapted to the current situation as “the new normal” and trades started to recover. However, it is Small Dry vessels’ ability to handle Containers and Dry Bulk which is proving beneficial for this ship type currently, in the wake of Covid.
Small Dry earnings are benefitting from a ripple effect caused by strong and improving rates in the Container and Bulker sectors. Container rates have been soaring since July 2020 due to post-Covid demand recovery, with Post Panamax Container rates now 300% higher than they were compared to this time last year, reaching an impressive $64,000 per day in June 2021. Bulker rates have also been growing overall since the start of 2021, with rates reaching 3 year highs for some types, as stimulus spending continues to be implemented and demand for dry goods confidently recovered. The rapid and prolonged recovery in these sectors is rubbing off on Small Dry as they have shown positive demand trends in the first and second quarter of this year so far, as many switch to carrying containers and increased amounts of dry commodities. Although current levels have increased and time charter rates are 60% higher than this time last year, we are still far from the historic highs seen in 2009 which saw time charter earnings close to 15,000 USD pd, compared to the current 10,000 USD pd.
Figure 1 shows journey counts for all Small Dry ship types in the first five months of the year, compared to previous years.
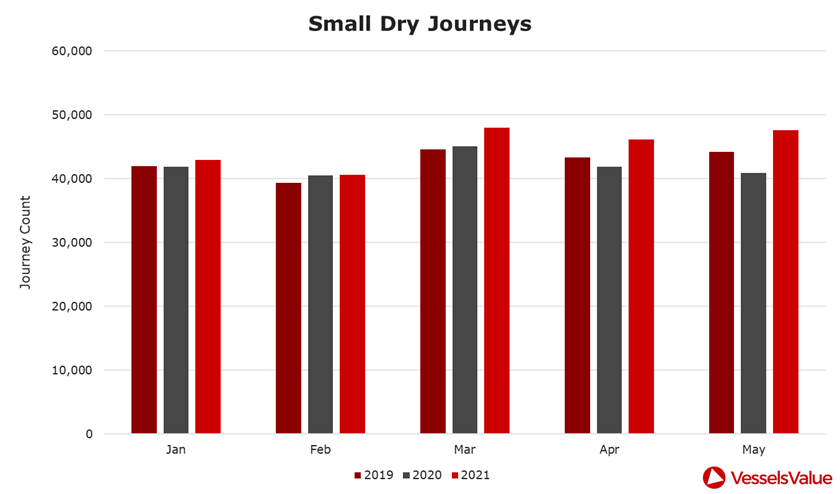
As expected, due to the impacts of Covid and reduced operations globally, journey counts so far this year have increased from last year. However, an increase can also be seen when comparing pre-Covid 2019 journey counts, with this year. In April and May, journeys increased by 6.5% and 7.5% respectively, when comparing 2019 and 2021 figures. This suggests that demand for these vessel types has risen as more journeys are completed.
MPP and Heavy Lift: Project Cargo to Containers
As available Containership capacity has tightened due to demand peaks and vessels being booked for longer charters, MPP and Heavy Lift vessels are being used to carry more Container freight than usual to deal with the shortage in available Containership tonnage. Whilst larger vessels (>20,000dwt) are often trading on the standard liner routes (i.e. from the Far East to Europe and vice versa), it has been noted that lately some smaller vessels transporting containers are being utilised on these trade lanes as well. Typically, these smaller vessels operate on domestic legs, with the top domestic routes over the past year being between Japan, China and Russia. However, due to the nature of the cargoes being transported, vessels are seen to be taking longer voyages and, in some cases, working on traditional Container liner routes. As a result, we are seeing cargo miles increase.
MPP and Heavy lift cargo miles have been on an upwards trajectory for the last 3 months. Figure 2 shows global cargo miles over the past year for the ship type.
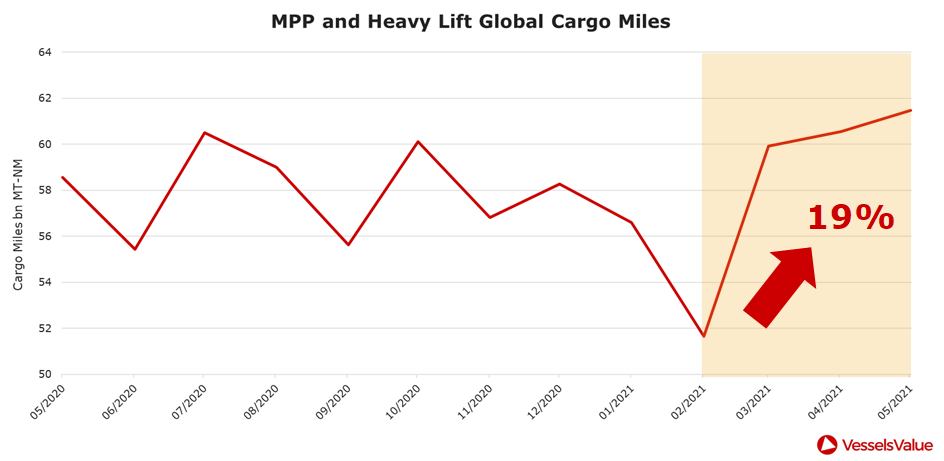
Since February 2021, cargo miles have increased by nearly 20%, which suggests a good recovery from the typical February lull after the Chinese New Year. Cargo miles have also increased YOY, with levels 2.6% higher in May 2021 versus May 2019, and 5% higher versus May 2020. This is another positive sign that this vessel type is being utilised more and on longer laden legs.
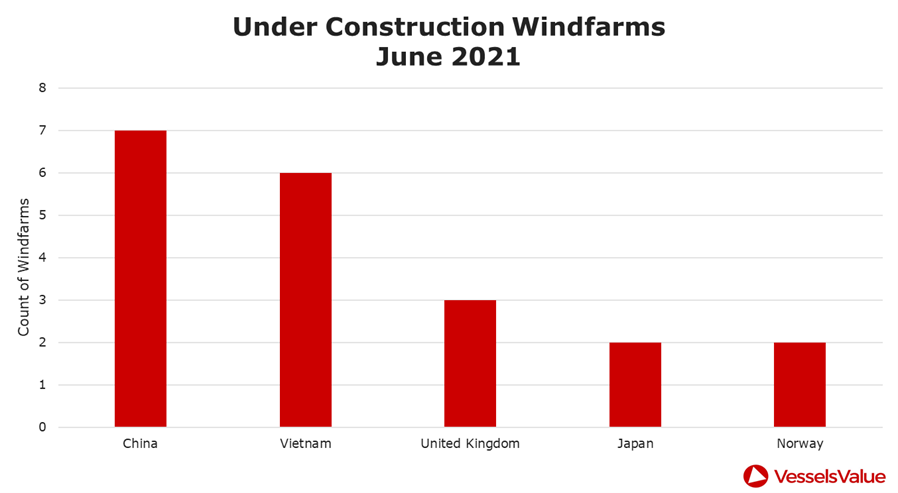
The future for MPPs is also supported by their handling of project cargo, as the ship type can expect to reap any shipping benefits as global energy supplies begin to turn green. As governments are increasingly pressured to invest in wind energy, the number of under construction offshore windfarms surpasses 20, with even more planned. This means the need for project cargo vessels and shipping wind components will only grow in these areas. See Figure 3 for the global distribution of current under construction windfarms, led by China.
Small Handy BC: Dry rates supporting smaller Bulkers
In a similar trend to MPPs and Containers, Dry Bulk rates are also feeding into the Small Handy sector, as dry commodities often handled by larger Bulkers are being booked for smaller vessels in order to keep up with demand. Furthermore, large bulk quantities transported on the major trade lanes are having to be parcelled again to serve smaller ports, which cannot be called at by Handy Bulker carriers or larger vessels. This increase in demand for Small Handy vessels is supporting supply and demand balance. Figure 4 compares cargo mile growth (demand) with fleet growth (supply).
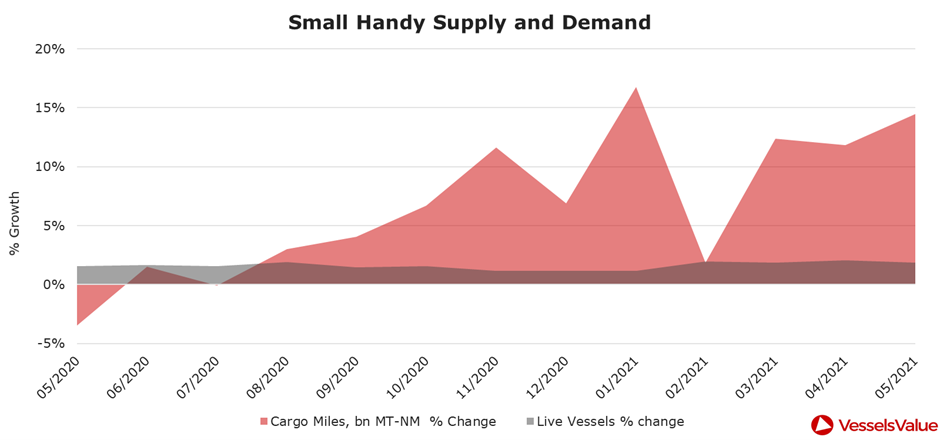
Small Handy supply and demand balance has stayed positive overall since August 2020, with cargo mile demand growth outstripping fleet growth by as much as 8% in the past 6 months. In February, cargo mile growth fell but soon recovered into March and we are now seeing continued growth. Cargo mile levels have grown by nearly 6% between April and May this year, and we could see continued growth if the Dry Bulk trend continues into Q3.
Alongside improving demand, Small Handy speeds are also recovering after a volatile year in 2020. Figure 5 shows Small Handy laden average speeds since Jan 2019.
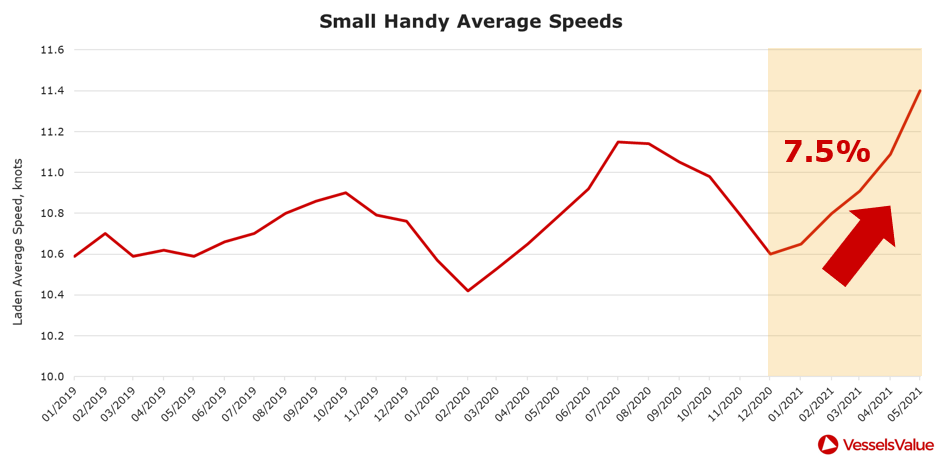
Small Handy speeds have also been rising in line with recovered demand and an uptick in Bulker rates this year, with laden speeds increasing by 7.5% between December 2020 and May 2021. Speeds have also risen compared to pre-Covid times, rising by 8% when comparing May 2021 and pre-Covid speeds in May 2019. Vessels moving faster suggests vessels bookings are increasing and is a good sign for the Small Dry sector.
Impact on Values
As discussed earlier, the increased earnings and market sentiment across the Small Dry sector has had a positive impact on values. Since the beginning of 2021 we have seen a general increase in values across the Small Dry segment. 5 year old Small Handy Bulkers have increased c.10% in value and the MPP fleet has increased by c.11% since January.
This is reflected in recent sales. On the 6th May 2020, the Squamish (18,500dwt, Small Handy BC (Geared), 3x30CR, Jul 2009 Yamanishi Zosen) sold for USD 6.5 mil, with VV’s value the day before sale at USD 5.84 mil. 1 year later the Lalinde (18,900dwt, Small Handy BC (Geared), 3x30CR, May 2006 Yamanishi Zosen) sold at USD 6.80 mil SS due, with VV’s value the day before sale at USD 6.17 mil. This shows that the 3 years older Lalinde, with identical specifications to the Squamish, has sold for a higher sale price due to the recent uptick seen in the market.
With there being fewer sales in this sector due to the increased demand and Owners now holding onto their assets to make the most of the higher charter rates, it will be interesting to see the effects on the S&P market with the common summer downturn. Along with the decreased S&P activity, we have also seen very few orders being placed for Small Dry. This decrease is a result of the lack of free slots available in shipyards due to the surge in Container orders, the fact these MPP vessels are more complicated to build as yards prefer to build standard designs from other segments like Containers or Small Bulkers, and the increased steel price driving up the cost of newbuilds.
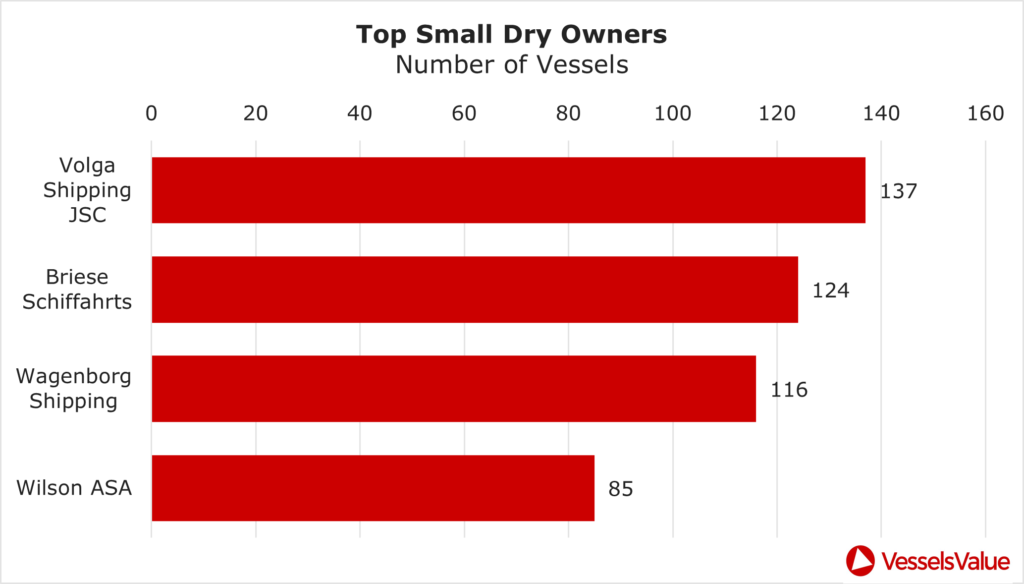
Figure 6 shows the top 5 Small Dry Owners by the number of vessels.
Fleet values across the Small Dry sector have increased, demonstrated in the table below with the percentage growth in fleet value across the top 5 owners of Small Dry vessels from June 2020 until today.
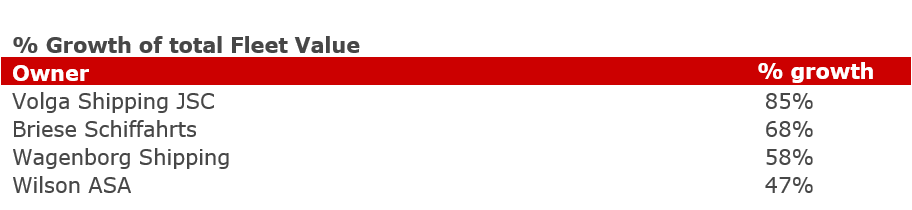
The rise in the fleet of the Volga Shipping is a result of a merger with Northwestern Shipping Company and not due to common market transactions announced in June 2020.
Whether the market will continue to climb will be seen in the next coming months, but Owners have benefitted from increased charter rates and rising fleet values.
Summary
The versatility of the sector is paying off for Small Dry vessels as they capitalise on the lack of capacity in the larger Container and Bulker sectors and extraordinary rates. As we begin to see Small Dry vessels chartered on routes and moving goods typically suited to larger vessel types, cargo miles and speeds are increasing, suggesting demand has improved. This has also resulted in an increase in values across the Small Dry sector.
The first two quarters of the year show signs of demand improvements are also supported by project work picking back up in the wake of Covid, so this fruitful period for Small Dry is expected to continue at least in the short term. However, caution still applies as the impressive Container demand and rates that have played a part in bolstering this sector are not expected to last forever, so we could see Small Dry demand weaken when this finally happens.
VesselsValue data as at June 2021
Disclaimer: The purpose of this blog is to provide general information and not to provide advice or guidance in relation to particular circumstances. Readers should not make decisions in reliance on any statement or opinion contained in this blog.
Want to know more about how our
data can help you assess the market?