Tankers: Covid cloud continues to dampen the Dirty Tanker market, whilst glimmers of recovery surface for Clean Tankers
Using VesselsValue Trade, we will assess the current status of the Tanker market, using historical and current AIS derived supply and demand data.
Dirty Tankers: Demand and Rates continue to fall
The impacts of Covid for the dirty Tanker market are still very present as rates continue to deteriorate into May. After making a small recovery towards the end of March, VLCC rates dropped again at the start of May to below OPEX, resulting in over a 100% year on year decline. Alongside weak earnings, crude Tanker demand is also showing few signs of recovery.
Back in early 2020, reduced demand due to Covid19 was in fact supporting the Tanker market, further intensifying the need for floating storage, as refining curtailed and onshore storage reached capacity. However, crude Tanker demand experienced a rapid decline between May and October in 2020 as cargo miles fell to lows not seen since 2016. A Covid related demand slump was finally impacting the Tanker market and 6 months on, things have hardly improved since. To illustrate this, figure 1 shows crude Tanker global daily cargo miles since January 2020. Cargo miles combine actual distances sailed by each vessel and estimates of cargo volumes (number of Containerships) to indicate the true demand for vessels.
This year, crude Tanker cargo miles stayed consistent between January 2021 and March 2021, until they took another blow in mid April when cargo miles fell again to 30.68 DWT bn-NM. This was 9% lower than cargo miles at the same time in April 2020, when Tanker rates were soaring due to a contango oil market and around 10% of the dirty Tanker fleet was being used as floating storage.
Dirty Tankers: Supply VS Demand
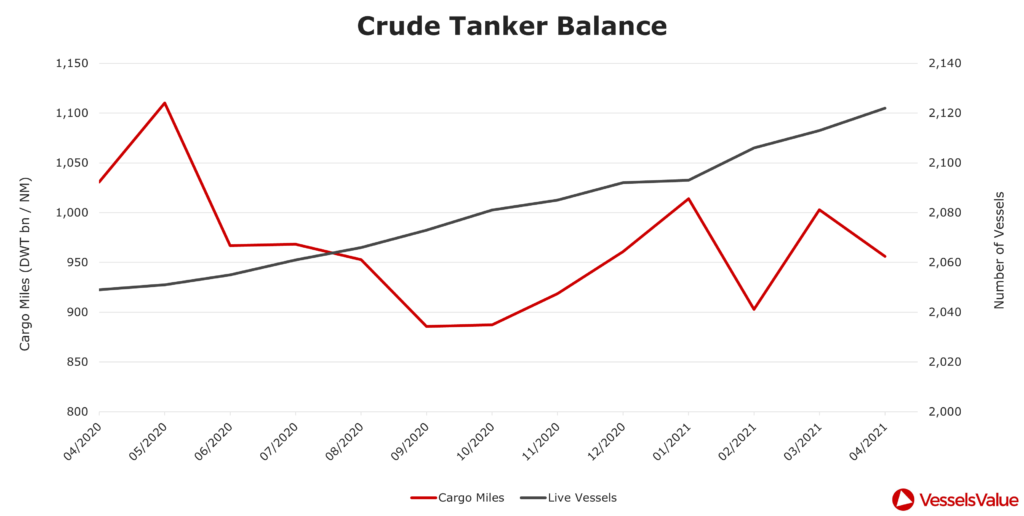
Cargo mile demand can also be compared with fleet growth for insight into market balance. Figure 2 shows the year on year percentage growth change for demand (cargo mile growth) and supply (fleet growth). Since Jun 2020, cargo mile growth has been negative, with the relatively stable fleet growth outstripping demand for the last 11 months.
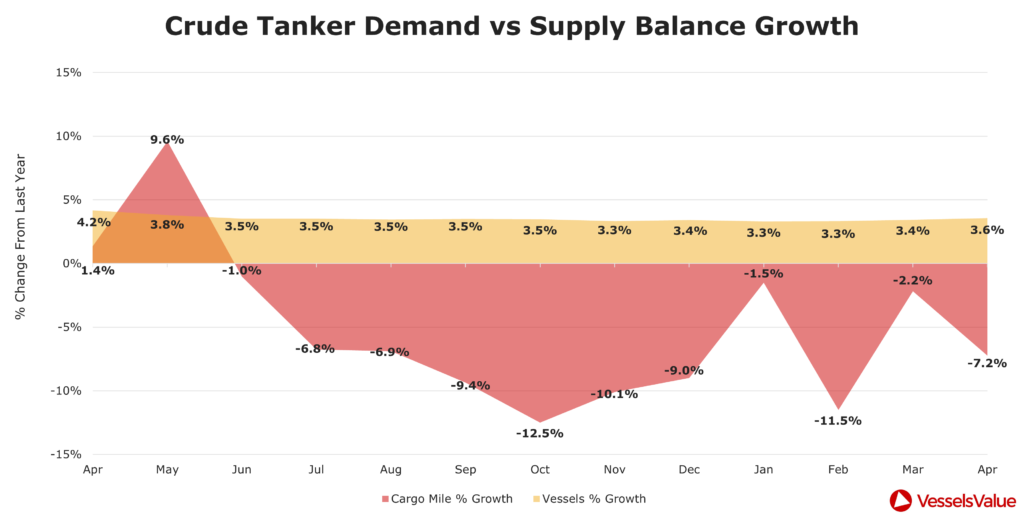
At the lowest point, cargo miles were 12.5% lower in October 2020 versus pre-pandemic levels in October 2019. Despite a large number of scrap candidates, weak cargo mile demand coupled with a crowded VLCC orderbook is expected to prolong the current supply and demand imbalance well into 2021, as the oversupply of available vessels continues.
Dirty Tankers: Routes
Global crude demand is still predominantly being carried by demand in the East, with China being the main consumer, supporting Chinese refiners. crude Tanker demand into South East Asia was confidently growing for the first three months of this year, increasing by 42% between the start of January and mid March. However, demand started on a downwards trajectory into May, falling by 34% between mid March and May. This suggests that even the driving force of crude imports (South East Asia) is still showing signs of volatility.
Hopes are that global oil demand must pick up at some point, but these hopes are further threatened by the resurgence of Covid outbreaks in some countries, especially India. India is a significant importer of crude oil, ranking third place for the highest cargo miles in the past year. Global cargo miles into India grew by an impressive 81% between the end of November and mid-December 2020, as the number of Covid cases had declined. Since then, between mid December and May 2021, cargo miles have fallen again by a further 20%, as the number of Covid cases has surged in recent months. Figure 3 shows the top 5 dirty Tanker destinations in the past year.
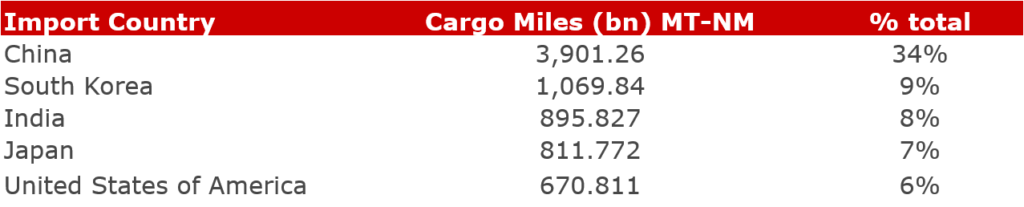
With nearly 500 crude Tanker journeys in the past year heading into the country, equating to 8% of global cargo miles, the Covid crisis in India reminds us yet again how demand is still being jeopardised by the virus. With strict lockdowns reducing the need for oil and causing operational blocks.
Clean Tankers: Improvement seen in Cargo Miles
The clean Tankers market is by no means out of the woods as Covid unpredictability remains, however, global demand data, coupled with earnings data, shows a slightly more positive picture for the clean market in recent months. MR rates increased rapidly in early May this year, reaching $20,000 per day. This was still 30% lower than rates in May 2020, but 400% higher than earnings at the end of April this year. Figure 4 shows clean Tanker (LR and MR) cargo miles and fleet count over the last year.
The chart shows how cargo mile demand recovered well in March after the annual lull in February, reaching 376 bn MT NM. This was higher than cargo miles in March 2019, pre Covid, suggesting that clean Tanker demand could be on the road to a modest recovery, as demand heads in the same direction as fleet growth. In April, cargo miles reassuringly remained high, only falling by 0.5% compared to March. We are also seeing clean Tanker exports out of China increase steadily since January 2021, as Chinese refining ramps up.
Clean Tankers: Speeds rising
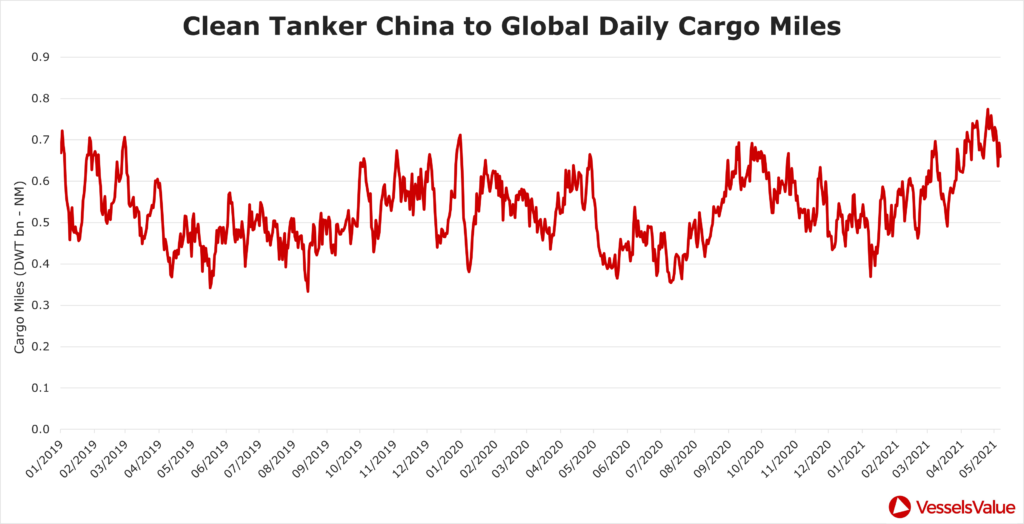
At the same time as improving demand, clean Tanker average laden speeds are also seen to be improving steadily since December 2020. Figure 5 shows clean Tanker laden average speeds since January 2019.
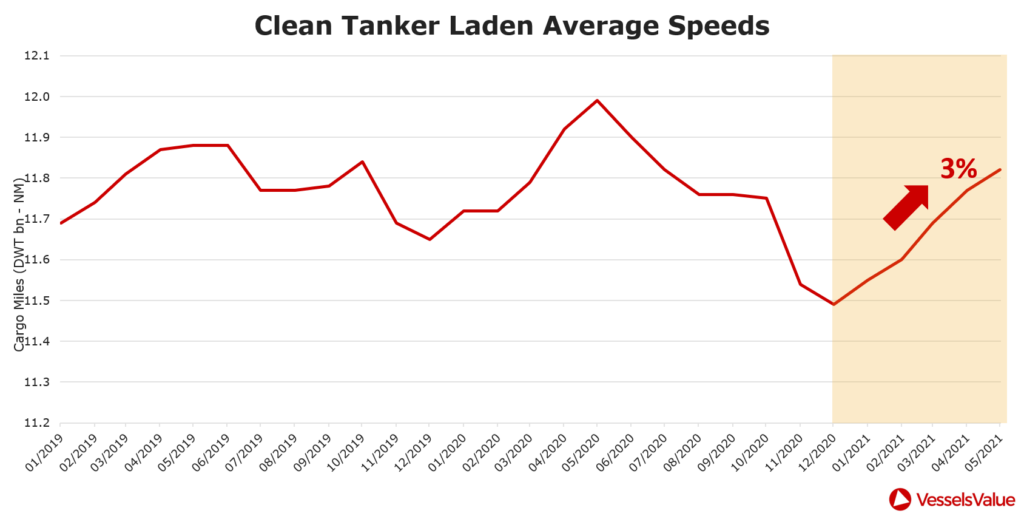
Clean Tanker laden speeds have been increasing month on month since the start of the year, growing by 3% between December 2020 and May 2021. Despite air travel still widely being at a standstill, lockdowns beginning to ease once again has meant that the consumption of liquid fuels such as petroleum and diesel is increasing. Cargo mile demand into North West Europe is a good example, remaining relatively stable since the end of last year when vaccination programmes were started. As vessel demand shows these signs of recovery, vessels are beginning to move faster, now surpassing speeds seen at the end of 2019, which is another indicator that vessel bookings are increasing.
Summary
With the unpredictability of Covid continuing to unsettle global trade, the Tanker market is still suffering the impacts of reduced demand and the reverberations of the floating storage surge this time last year. An imbalance in supply and demand continues across the dirty tanker sector, with a surplus number of vessels on the water, a growing VLCC orderbook and an unknown demand recovery timeline, as one of the world’s top crude importers suffers from a Covid resurgence. On the other hand, the clean Tanker sector is showing some signs of recovery when looking at the demand data. Clean Tanker speeds are increasing and cargo mile demand is rising in line with recent evidence of more promising rates. If the clean Tanker market continues in this direction and we see widespread vaccination success, then we could possibly see a more substantial clean Tanker recovery in Q3 of 2021. However, ultimately, the Covid cloud continues to threaten the Tanker market from both sides.
Trade data as at May 2021
Disclaimer: The purpose of this blog is to provide general information and not to provide advice or guidance in relation to particular circumstances. Readers should not make decisions in reliance on any statement or opinion contained in this blog.
Want to know more about how our
data can help you assess the market?