The Road to Recovery
It has been a tough few years for the Vehicle Carrier market. We have seen charter rates for 6,500 CEU vessels fall by more than 40% to $10,000/day in 2020, demand for global light vehicles flatlined in 2018 then collapsed in 2020, and as a result values have come under significant pressure. The industry entered 2020 cautiously, with auto analysts forecasting another challenging year. However, no one could have foreseen what was to come, COVID-19 decimated the global economy and sent the world into a double dip recession that effected every sector across the global economic landscape.
This article looks at the numbers in more detail to understand the underlying fundamentals driving decisions within the sector including fleet development, demolition sales, fleet age profile, cargo mile demand and layups. Concluding with a review of asset values.
Fleet Development
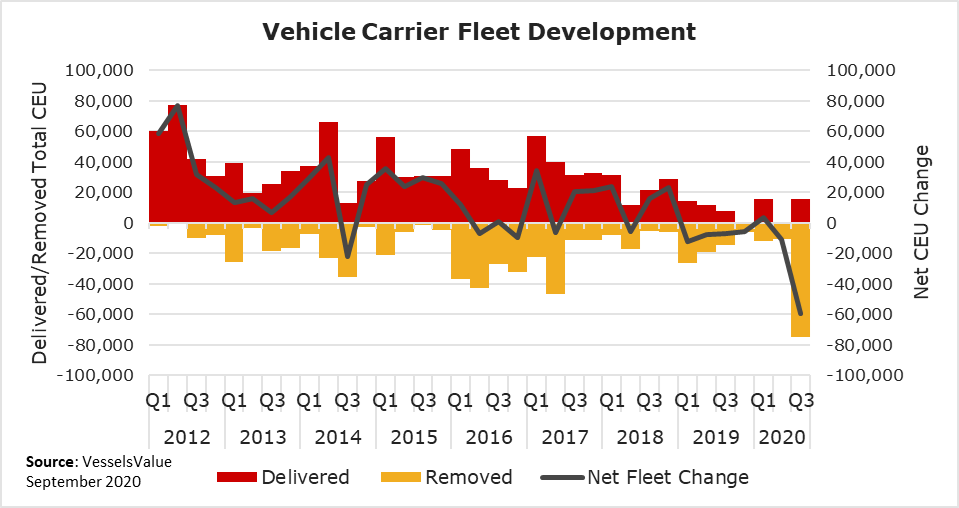
The Vehicle Carrier fleet is experiencing its biggest swing in fleet development since the global financial crisis of 2008-09, driven by the effects of COVID-19. Over 97,000 CEU has been removed from the fleet versus 30,000 CEU delivered in 2020, equalling a net fleet contraction of 67,000 CEU. If we include 2019, also a year of contraction, the net fleet reduction is 100,000 CEU.
Interestingly, these net decreases have had limited impact to the overall Vehicle Carrier fleet which remains in oversupply. As can be seen in figure 1, the market had significant over tonnage from 2012 until the end of 2015. With a similar trend in 2017 and 2018. From 2012 until 2018, fleet growth averaged 83,000 CEU per year. A sustained period of scrapping is needed to address this imbalance.
Fleet Removals
Scrapping activity for Vehicle Carriers gathered pace during the second quarter this year with Japanese owners leading the charge sending 12 PCTC’s to the breakers. A further 10 deals have been done since, with August averaging 1 vessel deal per week (figure 2).
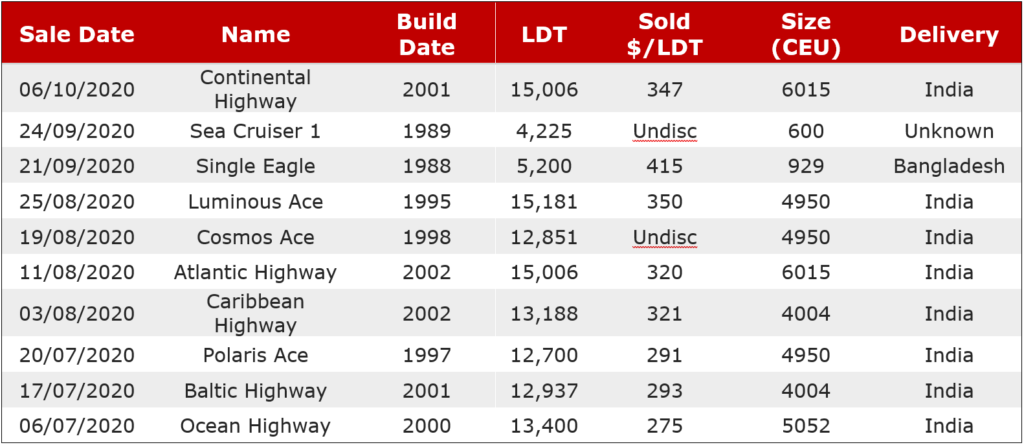
The trend for recycling younger vessels has brought the average scrap age down to 28.5 years tracing back to figures seen in 2008. The Atlantic Highway is the second youngest vessel to be sold for scrap on record. The youngest being the Diamond Highway sold in December 2019 aged 15.7 years. Additionally, the average size of recycled units is also increasing, up 13% in 2020 to 4500 CEU.
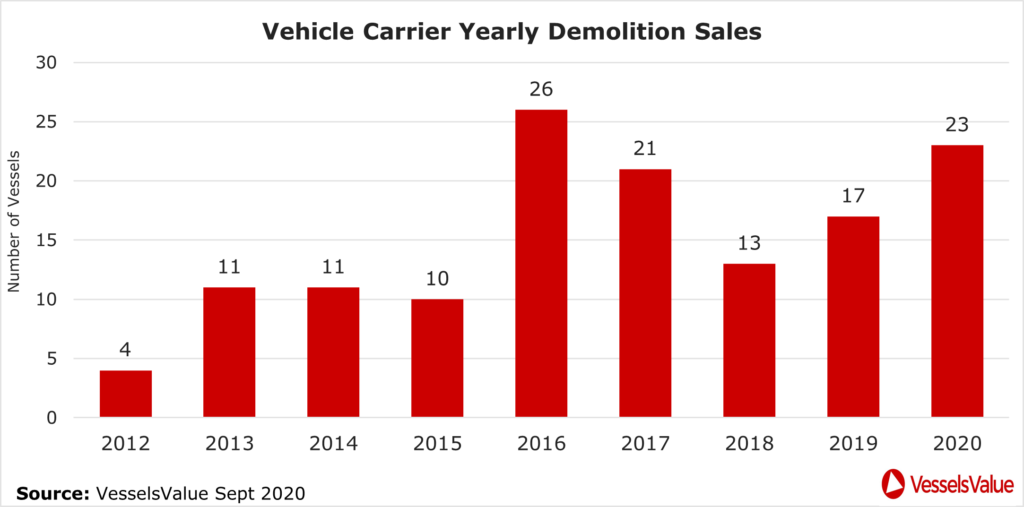
We expect to see further demolition sales as the Japanese shipping trio of NYK, MOL and K-Line press ahead with LNG fuelled replacements. Figure 3 shows that 2020 demolition sales are on track for a record year pro rata.
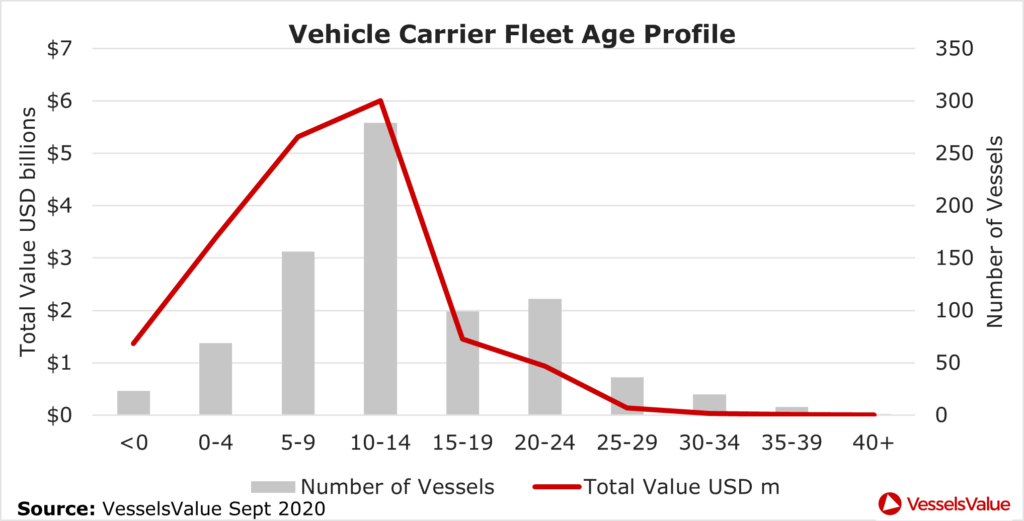
Fleet Age Profile
Analysing the Vehicle Carrier fleet age profile, there are 176 vessels aged 20 years or older (figure 4) representing 22% of the total fleet. At surface level these are prime candidates for demolition in the current market. Removal of this tonnage would help the sectors age profile and remove non-core tonnage from the competitive landscape. However, many owners may be unwilling to scrap their vintage tonnage due to it still having some form of earning capacity now or in the future.
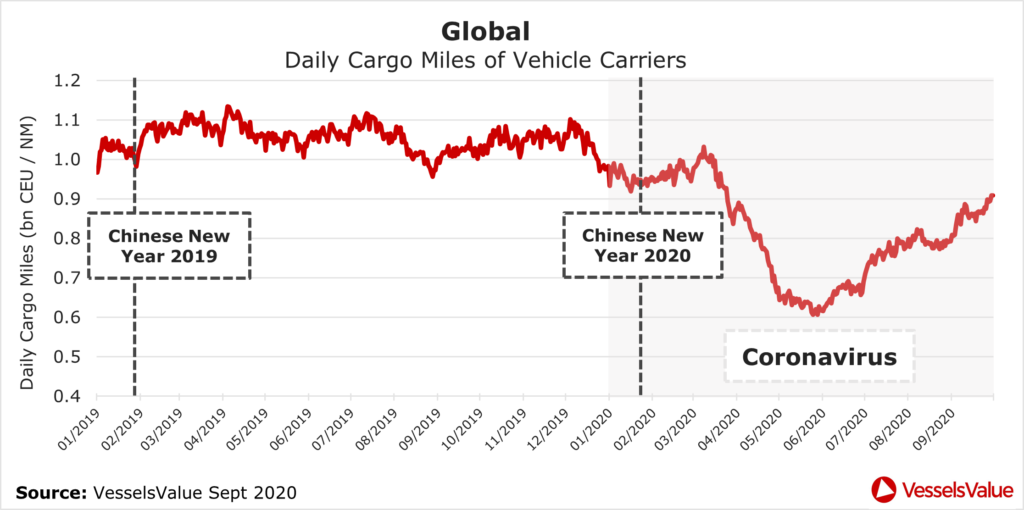
Cargo Mile Demand
During 2019, demand generally remained stable with the usual seasonal fluctuations. Figure 5 shows daily cargo mile demand for Vehicle Carriers expressed in billions of CEU (Car Equivalent Units) / nautical miles.
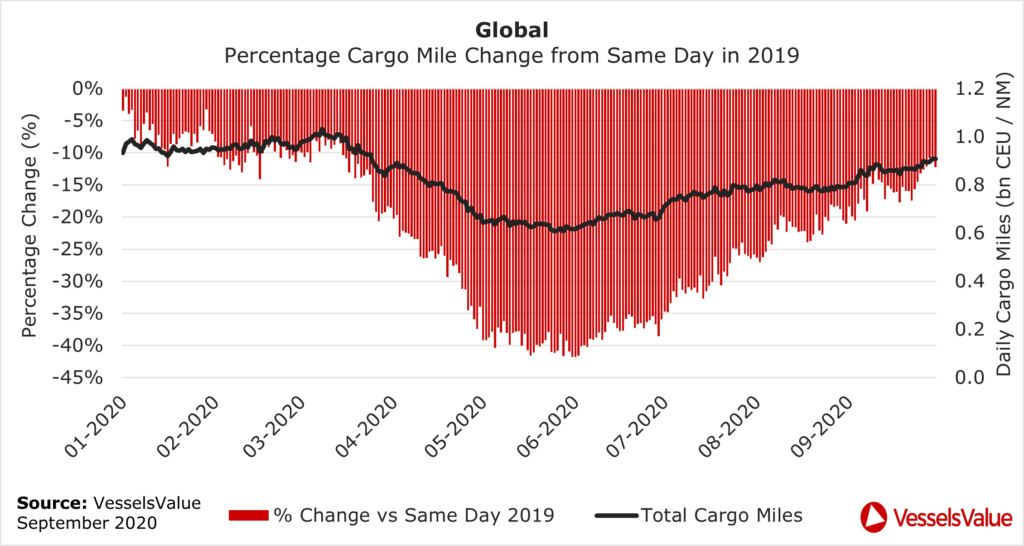
Enter 2020, demand took an initial 10% hit due to Coronavirus (figure 6). Then received the full whack as COVID-19 spread from Asia to the West, paralysing the market. Global light vehicle sales fell by a record 47.5% in April at the height of the pandemic as production virtually stopped in Europe. The knock-on effect to Vehicle Carrier demand was equally severe, down by 42% at the end of May. Figure 6 shows daily cargo mile demand in 2020 as a percentage change versus the same day in 2019. An excellent source of insight for current demand.
Demand has steadily improved from June but remained 16% down in September. China has registered five straight months of increase for light auto vehicle sales (circa.30% of the global sales market). However, this is nearly all from domestic production with less than 5% imported on Vehicle Carriers, thus the impact to CEU mile demand is minimal.
Vehicle Carrier Layups
COVID-19 has forced a number of operators to layup vessels. Utilising VesselsValue mapping recency of AIS function we can determine the total number of vessels recorded as stationary for 10 days or more at any given period. Figure 7 shows the results from January 2020 until the end of September 2020.
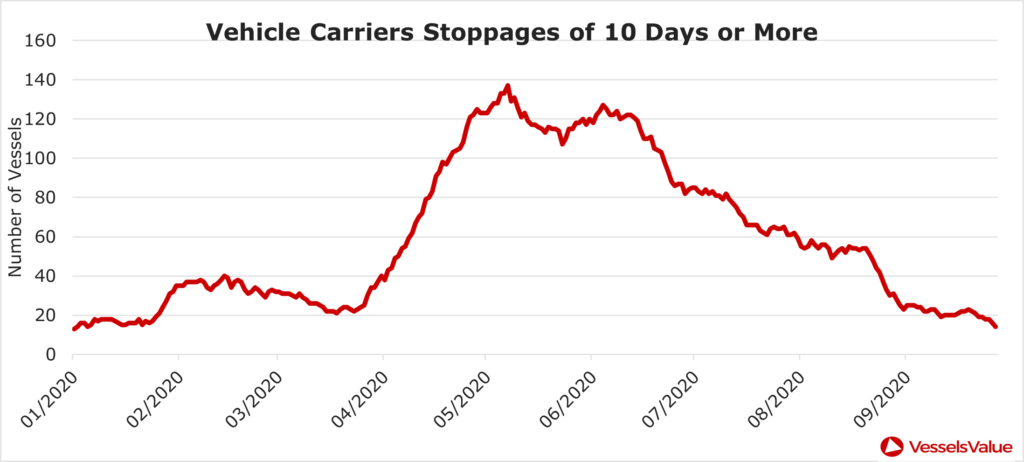
Layups hit their peak in May at 139 vessels, equating to 18% of the global fleet. But have since returned to levels seen earlier this year, now at 20 vessels. This is positive, and we expect to see an improvement in charter rates over the coming months as supply-demand fundamentals are more balanced albeit on a lower net fleet.
Values
Vehicle Carrier values have softened as a result of COVID-19, underlying weak demand and an oversupply of fleet as previously discussed.
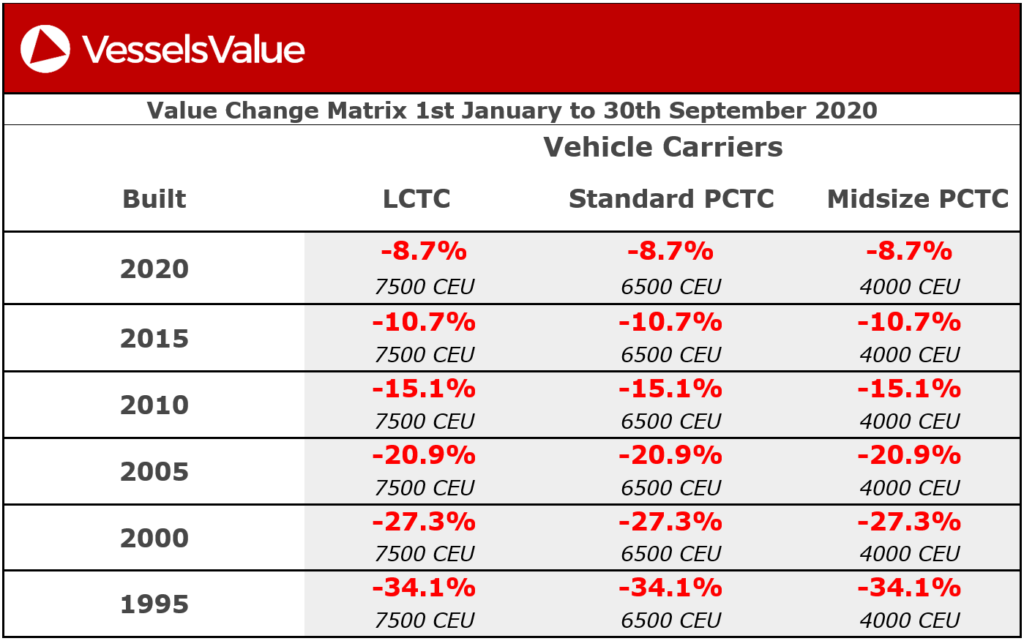
Figure 8 shows the percentage change in values between the 1st of January 2020 and the 30th of September 2020. Values have decreased across the board. The most notable effected are 20-year-old vessels which have lost 27%. Whilst mid-range 10-year olds dropped a less severe 15%.
5th of January 2020 the LCTC Hoegh Trotter 8,500 CEU built December 2016 valued at USD $64.48 million as per VV. By the 27th of September 2020, her value had dropped by $6.2 million, equating to -9.6% inside 9 months aged 3.8 years. A notable decrease for an illiquid market, but by no means unique.
Conclusion
Demand is recovering supported by increased removals improving the net fleet balance, but overall sentiment remains weak. Leading operator Wallenius Wilhemsen recently confirmed 15 owned vessels to remain in cold layup, an additional 5 being considered, and a further 3 will be selected for recycling later this year. Carriers are not expecting a recovery any time soon, managing capacity to a new post COVID-19 trading environment where demand is 16% below 2019. We therefore expect to see a continuation of scrapping trends into 2021. Until the weight of Coronavirus is removed, trading conditions will remain challenging. Values may fall further before the year is up.
Disclaimer: The purpose of this blog is to provide general information and not to provide advice or guidance in relation to particular circumstances. Readers should not make decisions in reliance on any statement or opinion contained in this blog.
Want to know more about how our
data can help you assess the market?