Trade Report 2021
Introduction and Overview
The Shipping markets saw unprecedented volatility during 2021 with time charter rates reaching all time highs in the Container and LNG markets, and decade highs in the Dry Bulk markets, before giving up a large portion of those gains at year end. The Tanker markets have truly been a story of two halves, with crude carriers printing below OPEX and even negative rates, while clean Tankers have seen a sustained, if modest, recovery in the last few months of the year. Commodity pricing, supply chain problems and associated port bottlenecks have been major factors behind many of those market moves, often helping to accentuate the fundamental impacts of ton mile demand and fleet capacity.
Bulkers
The first half of 2021 set the scene for the Dry Bulk carrier market, with evident market tightness leading to vessels achieving decade high charter rates. The market saw further strengths in the second half of 2021, though not a uniform rise across vessel sizes. The Baltic Dry Index hit a high of 5650 on 7th October 2021, a level last seen well over a decade ago in August 2008.
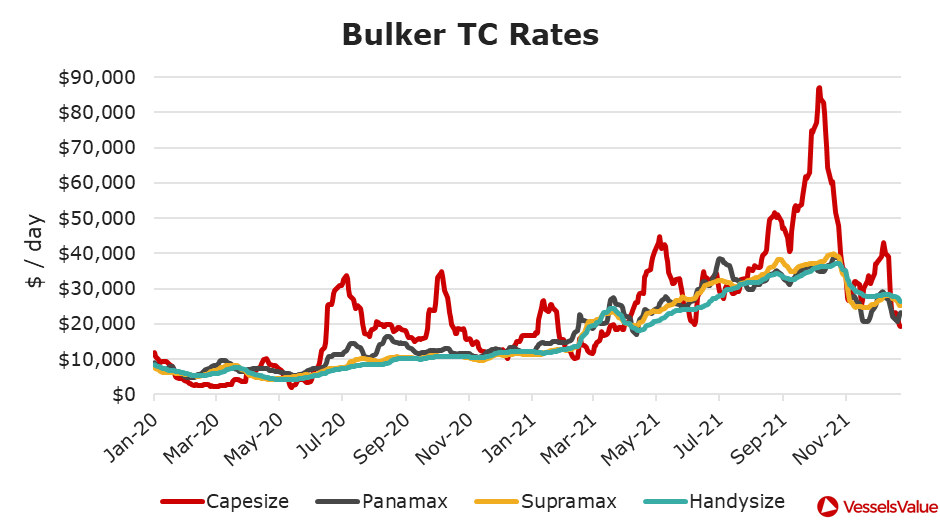
Bulker Earnings in H2 2021
The Capesize market provided the sparks once again, printing a daily index of $86,953 in early October, representing an almost 750% increase from mid February’s low, though finishing the year on a low point at just over $19,000. The smaller Bulker markets also had a stellar H2 2021, with all segments managing to hit their highest time charter rates in mid October, as shown in Figure 1.
Bulker Demand
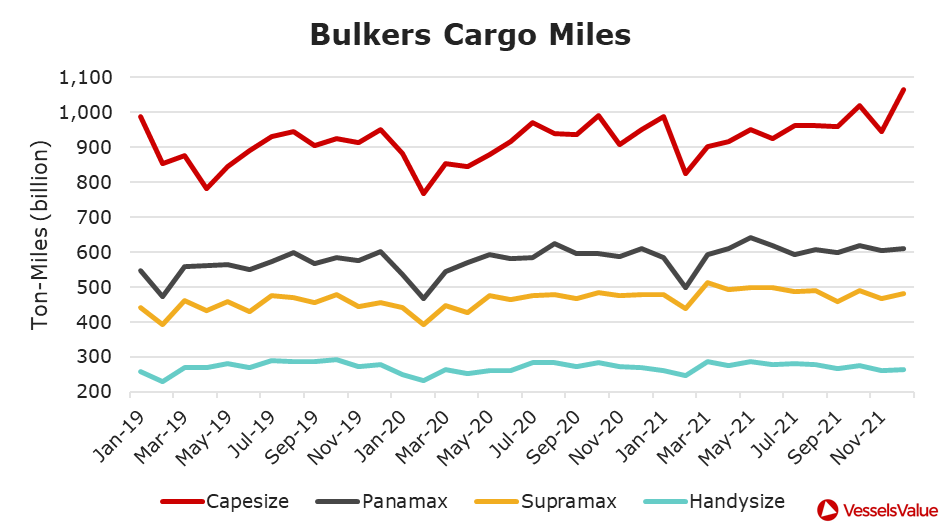
The solid fundamentals of the Dry Bulk markets in the second half of 2021 were confirmed by the strength in ton mile utilisation across vessel types, particularly for Capesize vessels. As is evident from Figure 2, the Capesize market saw the highest ton mile demand in the past 3 years, all in the last quarter of the year.
Contributing to the strong Dry Bulk market at the start of Q4, imports of iron ore by China, the world’s largest importer of the material, reached 105mn tons in November, the highest amount in over a year. Nevertheless, while illustrating some of the risks to the Bulker market, imports of iron ore in the second half of 2021 were still down overall by approximately 10% compared with the same period in 2020. This was largely a reflection of the Chinese government’s policy to limit annual steel output to the level set in 2020, but was also impacted by the slowdown in the Chinese property sector during the latter half of the year.
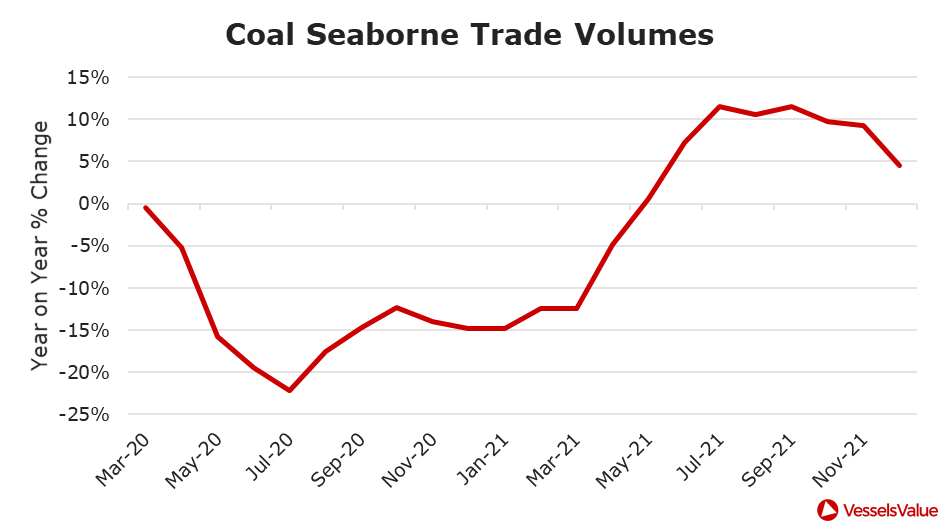
Most impactful for the Dry Bulk market, we saw a significant rebound in coal trade volumes in the second half of 2021. As evident in Figure 3 below, which shows the year on year percentage change in 3 month moving average volumes, the coal trade had one of its best years in recent times, with volumes climbing approximately 10% from 2020. The strength in the coal trade was largely driven by sharply increasing demand in Asia, associated with rapid growth in energy generation. The shortage of coal during the period was such that at times, several Chinese provinces were forced to implement rolling power blackouts. Mirroring the surge in global gas prices seen in the last several months of the year, global coal prices also rallied sharply over the period, with the Newcastle benchmark rising to $270/ton in early October, representing more than twice the previous high set in 2011.
In addition to the scramble for coal loading vessels at the start of Q4, the market for larger vessels was supported by the continued dislocation of global coal trade flows, as a result of the Chinese ban on Australian material and associated increases in average sailing distance.
While sharply stronger coal shipments had been incredibly supportive for the market in the second half of 2021, there were clear risks that this factor could have unwound fast. Specifically, Chinese authorities in October ordered domestic coal miners to run at maximum capacity to increase production, and domestic production had already responded. Chinese domestic production hit a monthly output of 385mn tons in December 2021, an almost 20% jump from the average production rate of 320 to 325mn tons earlier in the year, flagging risks to forward import demand.
Bulker Congestion
In addition to growing Bulker demand, rising congestion at ports had been a significant contributing factor to the strong time charter rates we saw over the last 6 months. Indeed, Figure 4 below shows record levels of Bulker congestion, hovering at 4 billion tonnes per day each month in the latter half of the year. As ton days represent the fleet capacity which is “congested” multiplied by the average number of days waiting, the congestion levels are equivalent to approximately 670 Capesize vessels (or just over a third of the Capesize fleet) waiting at port at any one time.
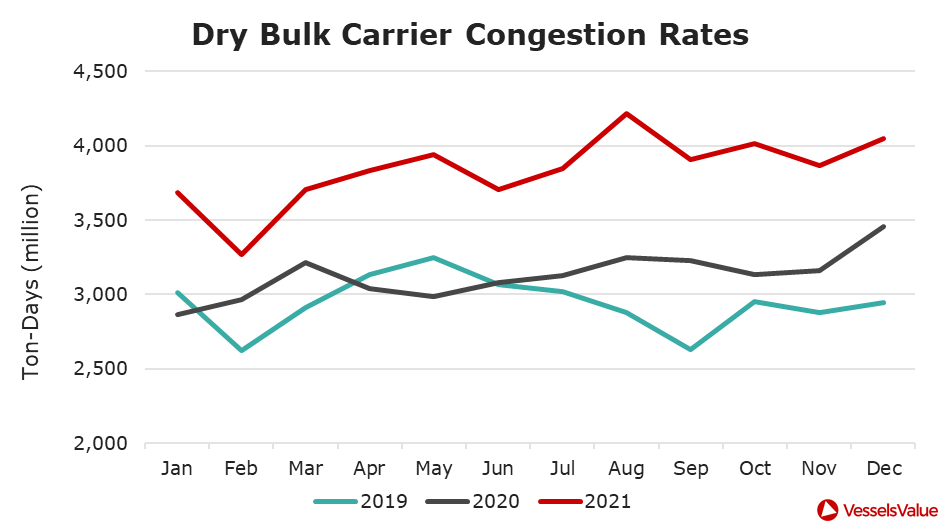
While the Bulker market performed exceptionally well during the second half of 2021, any slowdown in trade growth in 2022, especially if accompanied by an unwind in port congestion, is likely to present significant risks to Bulker earnings.
LNG
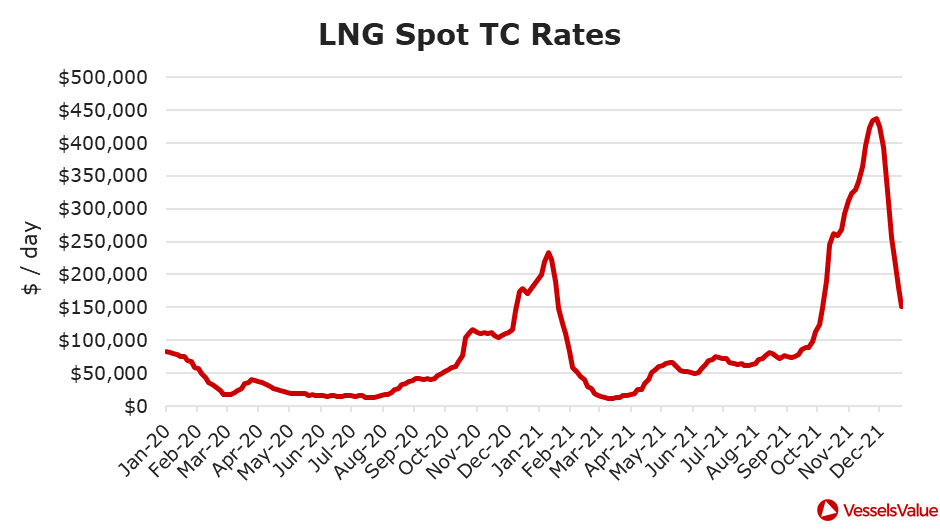
While high Asian LNG prices at the end of 2020 on the back of severely cold weather resulted in a scramble to charter LNG vessels and a surge in LNG carrier TC rates, the last few months of 2021 witnessed an even more dramatic jump in LNG carrier rates. At the end of November, rates reached a high of over $430,000/day, almost twice the previous record, though rates had settled to a modest $150,000/day by the end of the year, as shown in Figure 5.
Gas Demand Meets Supply Squeeze
The extreme demand surge for LNG carrier capacity mirrors the global natural Gas price rally witnessed in the second half of 2021. In particular, Gas prices have been driven by 5 main factors: i) very low European stock levels, resulting from colder than average 2020/21 winter and reduced European Gas production, ii) sharply lower flows of piped Gas imports into Europe from Russia, iii) strong demand in Far East Asia, driven by economic recovery and pre-emptive stock building, iv) strong South American demand due to drought conditions impacting hydro power generation, v) record European carbon credit prices favouring Gas for power generation over coal.
With the news of the suspension of Gazprom’s Nord Stream 2 pipeline, Gas prices in Europe reacted furiously, rising to attract LNG cargoes away from the typically higher priced Asian markets. The scramble to source LNG cargoes for both Asia and Europe was naturally accompanied by a scramble to charter LNG vessels which could load promptly, primarily in the US Gulf Coast, but also other Atlantic exporters.
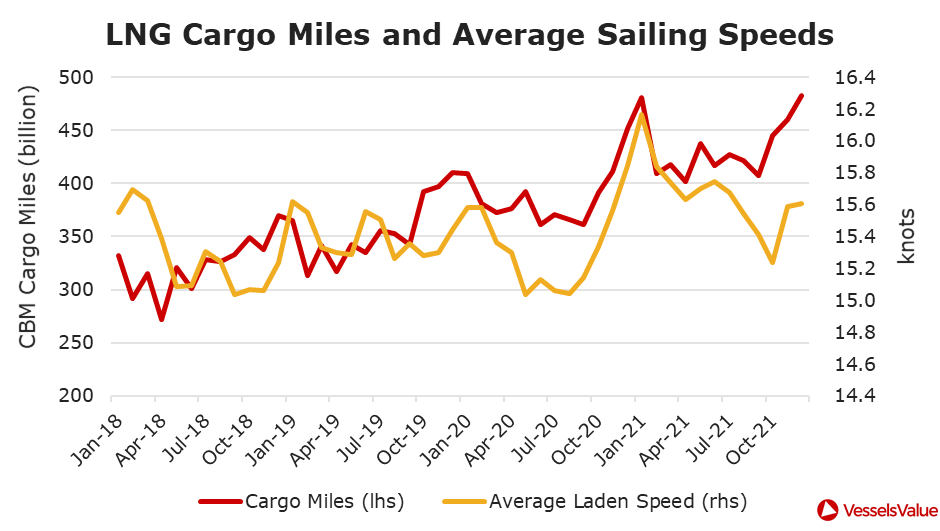
The result was a significant and sharp rise in vessel utilisation rates hitting the highest on record in December, as evident in Figure 6. Crucially, and in contrast to what we saw in December 2020, average sailing speeds did not respond as significantly and as quickly to the increase in capacity demand, thereby allowing time charter rates to surge the way they did.
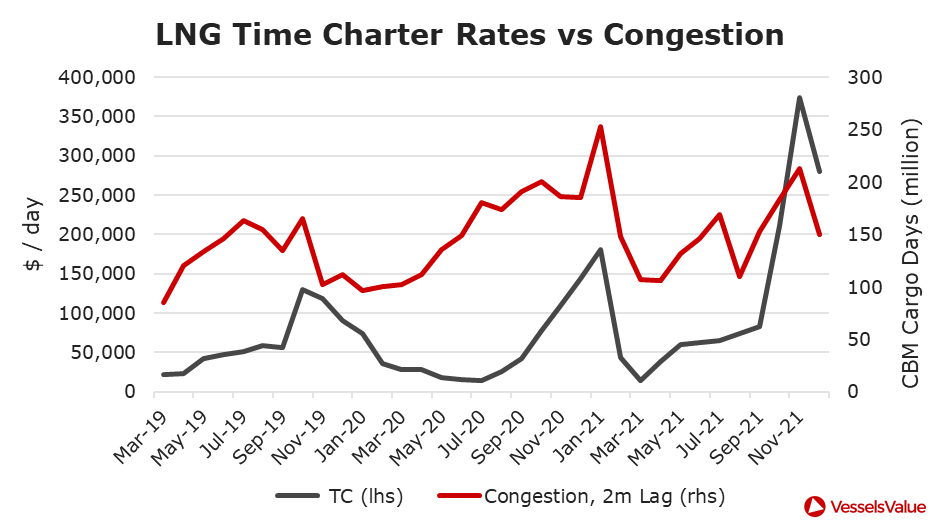
As a consequence of the sharp increase in LNG chartering demand, we witnessed a significant increase in congestion at LNG terminals in the August to September period hitting over 200 million cargo days per month being lost to congestion, as detailed in Figure 7. In terms of capacity, at its highest, this represented around 7 million CBM of LNG carrying capacity (slightly more than the total Q Flex fleet) waiting at ports throughout September. This helped to further tighten the market for LNG carriers, boosting charter rates to the record highs we saw in Q4’21.
Containers
While the first half of 2021 saw owners and operators in the Container market achieve record earnings, the bull market was only just getting started. Indeed, while the hire rate for a Panamax Container vessel at the end of June was at an unprecedented until then $45,000/day, it had reached $87,000/day by the end of October for an increase of almost 100%. Equally, average rates over the last 6 months of 2021 were 150% higher than the rates achieved in the first 6 months of the year. While overall strong demand and trade volumes supported the market throughout the year, rates seemed increasingly driven by port congestion, delays and bottlenecks.
Slowing Demand and Rising Congestion
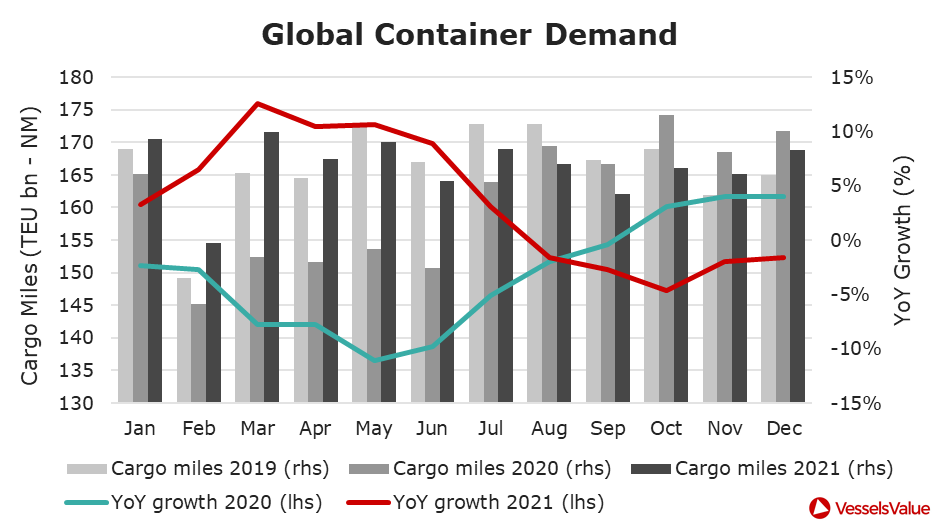
The boom in global demand for Container Shipping, which started in the last quarter of 2020, continued unabated in the first six months of 2021, as European and US consumers shifted to buying more material goods instead of travel and services during the pandemic. For example, the port of Long Beach in Los Angeles, the busiest Container port in the USA, saw inbound TEU volumes increase almost 30% in the first 6 months of 2021, compared to the pre pandemic levels of 2019. This boom, however, started to moderate in the second half of 2021, when inbound shipments were only 16% higher than the same period of 2019. We observed the same dynamic in global Container demand, as measured by cargo miles utilisation, where a strong start in H1’21 gave way to an appreciably weaker H2’21, as seen in Figure 8.
Throughout 2021, and especially in the second half of the year when overall demand began to moderate, it was congestion and long waiting times at Container ports that served to tie up significant portions of the Container fleet. As an example, the number of TEU-days lost as a result of congestion were 56% higher in H1’21 compared to the same period of 2019, but almost doubling at 83% higher in H2’21 than the corresponding pre pandemic period. Global Container congestion reached a peak of 85 million TEU-days in August 2021; this is equivalent to all Container vessels in the fleet from Panamax and larger being sat and waiting.
Supply Chain Logjams
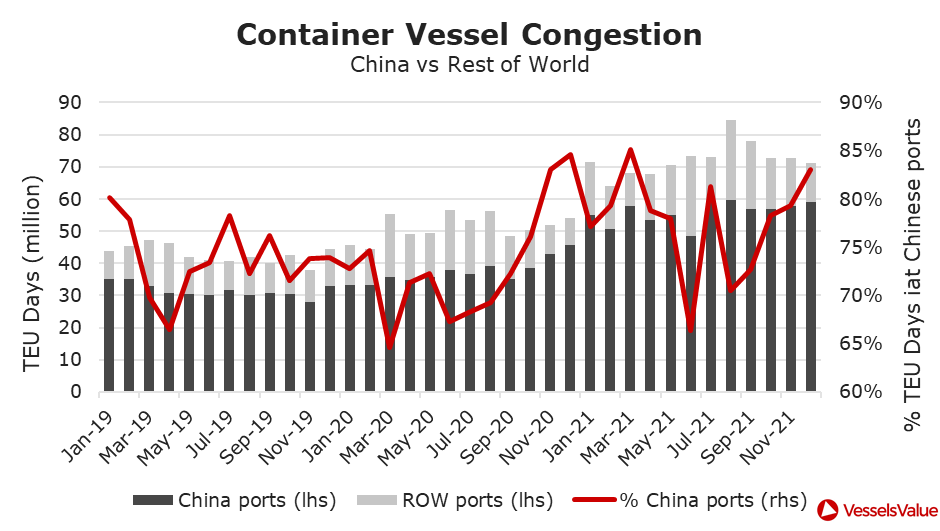
While long ship queues and long waiting times at US (Long Beach) and European (Rotterdam, Hamburg) ports have frequently made the headlines over the year, using detailed data on port level waiting times, we found that congestion rates increased the most at loading ports in China. For example, while congestion at import ports was 46% higher relative to the previous “normal year” of 2019, it had increased by 77% at Chinese ports, as shown in Figure 9. This suggests that fundamental supply side constraints, including product availability and localised Covid-19 outbreaks amid zero Covid-19 policies, have been important factors in driving up overall congestion rates through 2021.
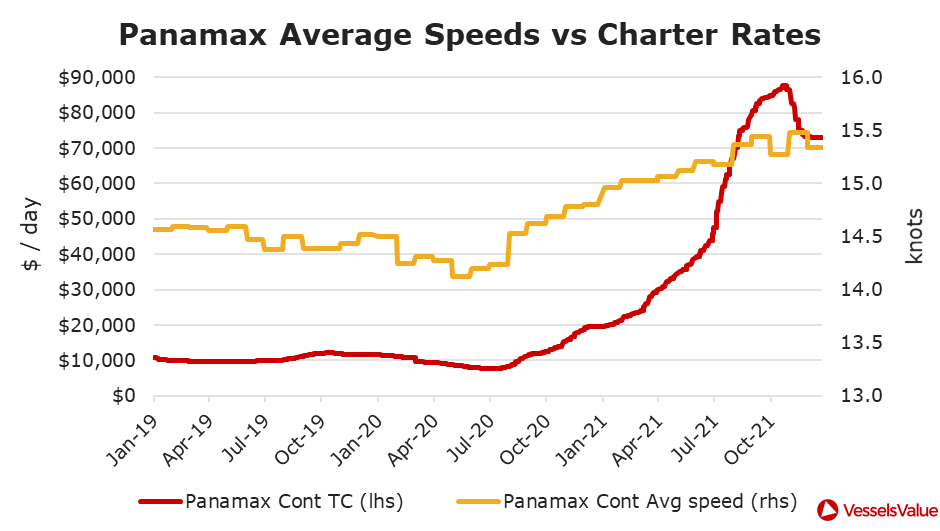
With Container rates rising sharply through the year off the back of the significant capacity restrictions associated with congestion, charterers continued to increase sailing speeds to an average of 15.5 knots towards the end of the year, as seen in Figure 10. While higher sailing speeds have somewhat helped increase the productivity of the fleet, the impact had been dwarfed by the continued logjams at the world’s largest ports.
Looking ahead, it is clear that the supply of Container tonnage remains extremely tight, amid solid demand and unprecedented levels of port and supply chain disruption. Thus, even in an environment where demand momentum were to begin moderately, it is likely that shippers and charterers would need to wait for an unwind in clogged up production and supply chains to see a meaningful relief in rates.
Tankers
Whilst other Shipping markets have seen strong and rising earnings through most of 2021, both the Crude and Clean Tanker markets have struggled throughout the year with low fleet utilisation and low time charter rates.
Crude Oil Tankers
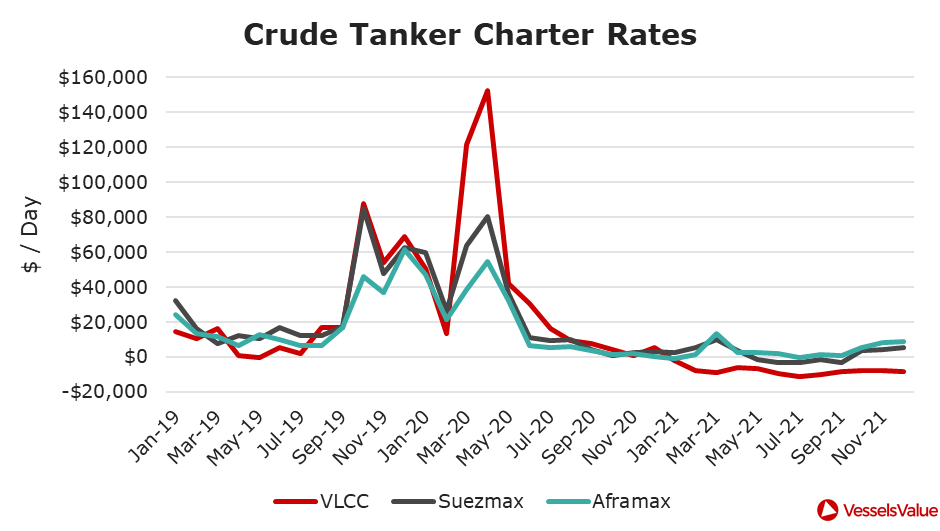
The rush to secure vessels for floating storage during the weak pricing and sharp contango structure in the Mar/Apr 2020 period led to a spike in time charter rates, with VLCCs hitting a high of over $200k/day. The unwinding of the storage trade as oil prices stabilised released a significant amount of tonnage into the market (up to 9% of Crude Tanker capacity was being used as storage) in late 2020 and through 2021. The extra capacity available was forced to chase ton mile demand that remained extremely weak, resulting in charter rates for Crude Tankers staying well below opex, and indeed negative for VLCCs, for most of 2021 as shown in Figure 11.
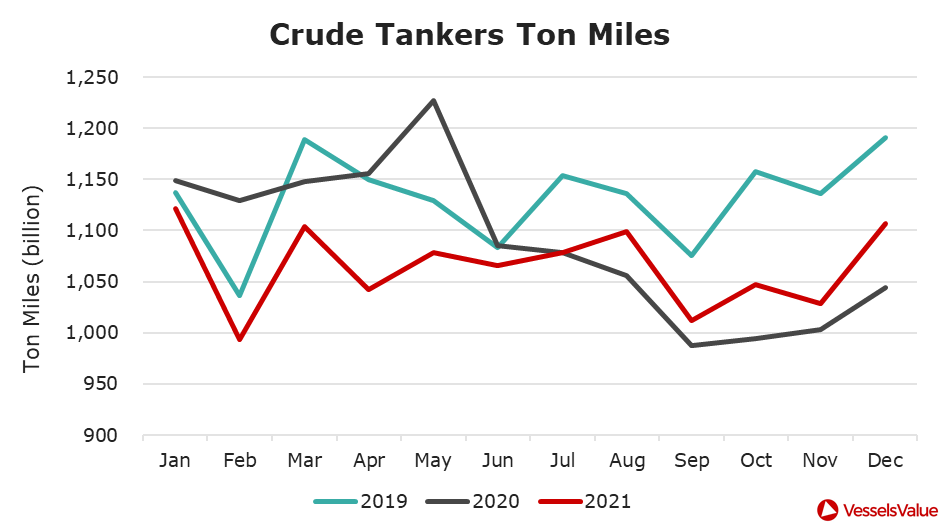
Illustrating the weak demand facing the Crude Tanker market, Figure 12 shows monthly Crude Tanker cargo miles over the last 3 years. While much of the sharp drop in cargo miles (approximately 20%) between May and September 2020 was the result of lockdown restrictions, impacting demand for oil and its products, it was noticeable that cargo miles have continued to track at a very low level through 2021, even as demand for oil had picked up and crude oil prices rose 50% over the course of the year.
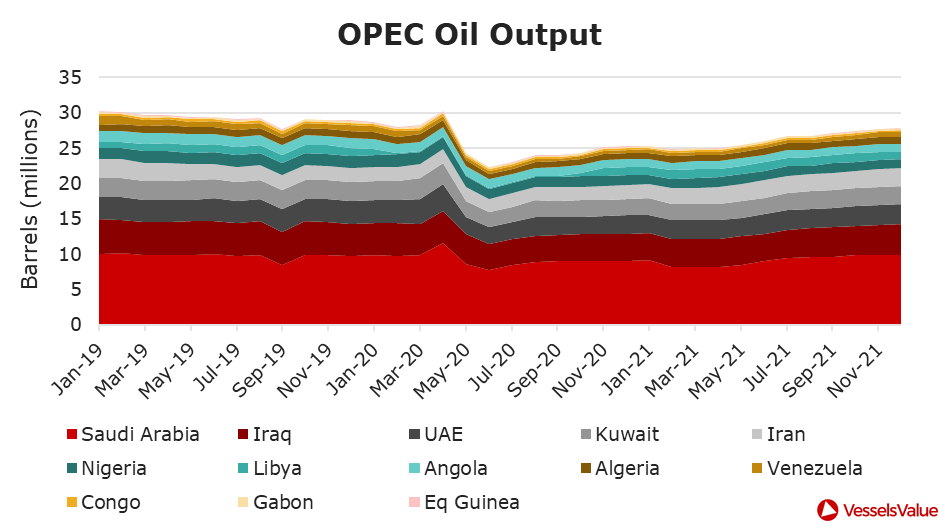
A primary factor behind the weak demand for Crude Tankers over the past year had been the oil producers’ very weak response to the recovery in global oil demand. Even though total OPEC oil production ended 2021 on an uptick, with production in December 2021 at 27.8mbd, this was still the lowest monthly output level since at least January 2009 (the depth of the recession caused by the 2008 global financial crisis). Overall, as Figure 13 below shows, 2021 OPEC production was 2.6% higher than in 2020, and 17.5% down on pre pandemic 2019 levels.
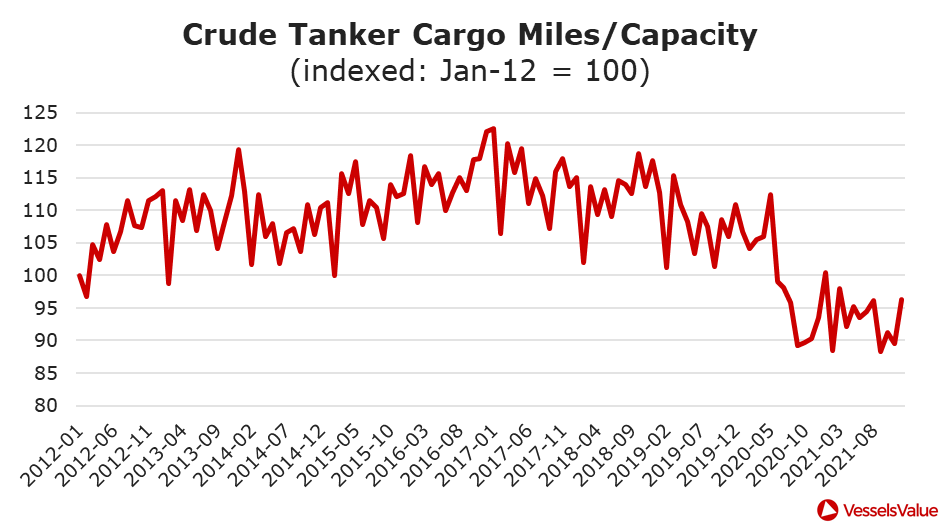
While the drop in available crude oil volumes were serious enough, we also saw significant growth in the global Tanker capacity over the 2020 to 2021 period. The Crude Tanker carrying capacity at the end of Dec’21 was over 31 million tons (or 200 million barrels, equivalent to 7% of capacity), higher than in Dec’19. The impact on ton mile demand available per unit of Crude Tanker capacity had been dramatic, as evident in Figure 14 below.
A bright light for the Crude Tanker market is the continuing strength in oil demand as we enter 2022, with economic growth and wider reopening across the world. In addition, strategic petroleum reserves in the US as well as other IEA member states, which were drawn down last year to limit the spike in oil prices, would likely need to be replenished and thus providing a further lift to demand.
Clean Product Tankers
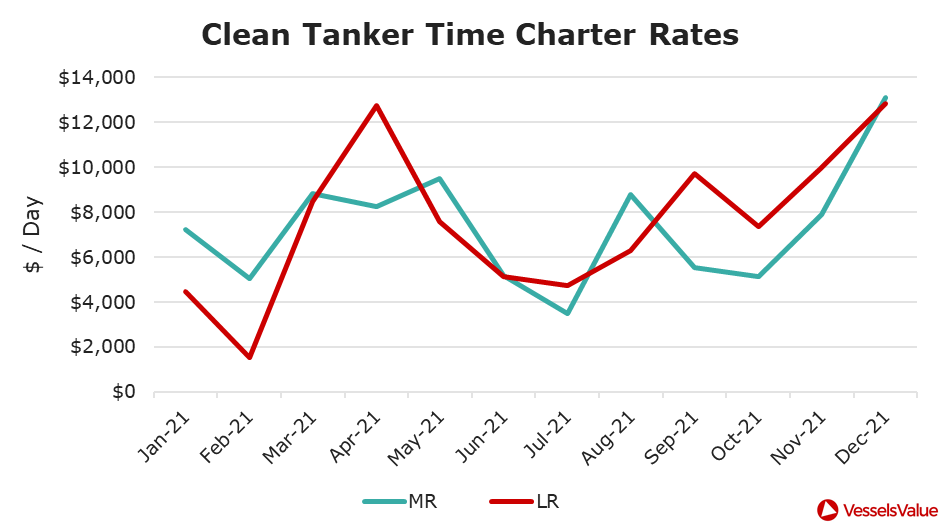
Clean Tankers were not immune from the poor market conditions for the Tanker fleet, with TC rates for 2021 averaging 51% lower than the pre pandemic 2019 for MR1/MR2 vessels and 64% lower for LR1/LR2 vessels. However, the background for the Clean Tanker fleet was noticeably more positive in the second half of 2021, with rates seeing sustained positive momentum, as seen in Figure 15.
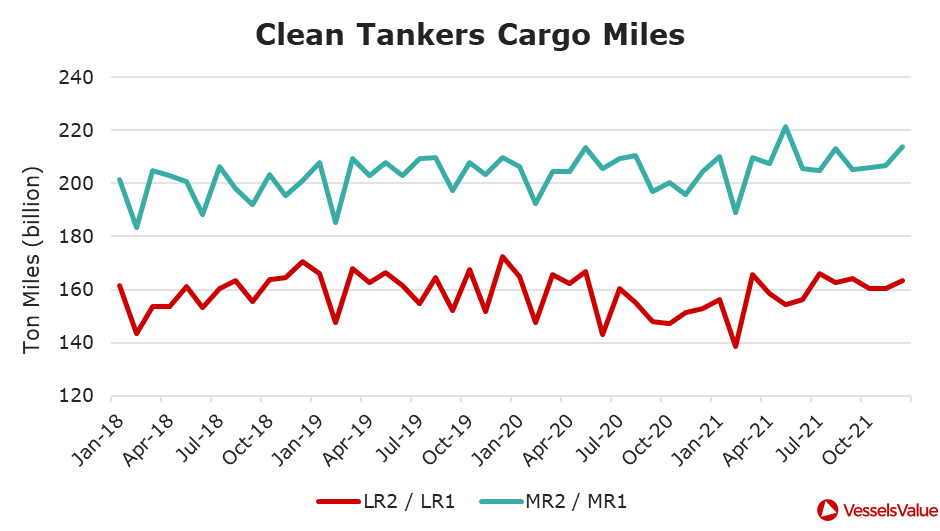
The second half of 2021 saw demand for oil products rebounding as lockdown measures were relaxed across much of Europe. This coincided with the return of refining capacity from turnaround maintenance delays to drive an increase in refining runs. Hurricane induced disruptions during August to September to refining capacity across the US Gulf region helped lift European refining margins, especially for gasoline. The picture was equally positive in Asia, where strong economic recovery encouraged use of oil products. Refining margins were further boosted by sharply higher demand for gasoil as power generators across the region sought substitutes to high priced coal and natural gas. The boost in refinery output over the period is mirrored in the increase in Clean Tanker ton miles, as shown in Figure 16, with H2’21 ton miles across the LR sector approximately 5% higher in the year 2021.
Ongoing recovery of travel demand globally as economies progressively relax restrictions, reflected in solid refining margins across regions, should sustain the positive fundamentals in the Clean Tanker sector. Coupled with limited recent contracting and an orderbook amounting to a modest 8% of the available fleet, the Clean Tanker market seems poised for further recovery in rates.
Conclusion
The Shipping markets, with the notable exception of the Tanker markets, continued their strong run during the second half of 2021. Across the Bulker, LNG and Container sectors, we saw significant growth in ton mile demand, driven by a strong economic recovery globally and by significant commodity price differentials between regions. Even in the Container sector, where we started to see a sharp moderation of the pandemic driven boom in the demand for durable goods, shipments were still approximately 15% higher than pre-pandemic times.
The impact of higher demand on time charter rates was accentuated by a sharp and sustained rise in port congestion across all Shipping sectors (other than Tankers), with significant portions of each sector’s fleet being tied up for prolonged periods of time. While much of the increase in waiting times globally had been associated with fundamental supply chain difficulties, any improvement could have a sharp reverse effect on fleet utilisation and hence rates.
The Tanker market has been the notable underperformer, as time charter rates for crude oil Tankers in particular persisting at all time lows. While demand for oil and its products have picked up as evidenced by significantly higher oil prices, supply and product availability constraints have been a major factor in constraining fleet utilisation.
VesselsValue data as of January 2022.
Disclaimer: The purpose of this blog is to provide general information and not to provide advice or guidance in relation to particular circumstances. Readers should not make decisions in reliance on any statement or opinion contained in this blog.
Want to know more about how our
data can help you assess the market?