
What’s driving the VLCC market?
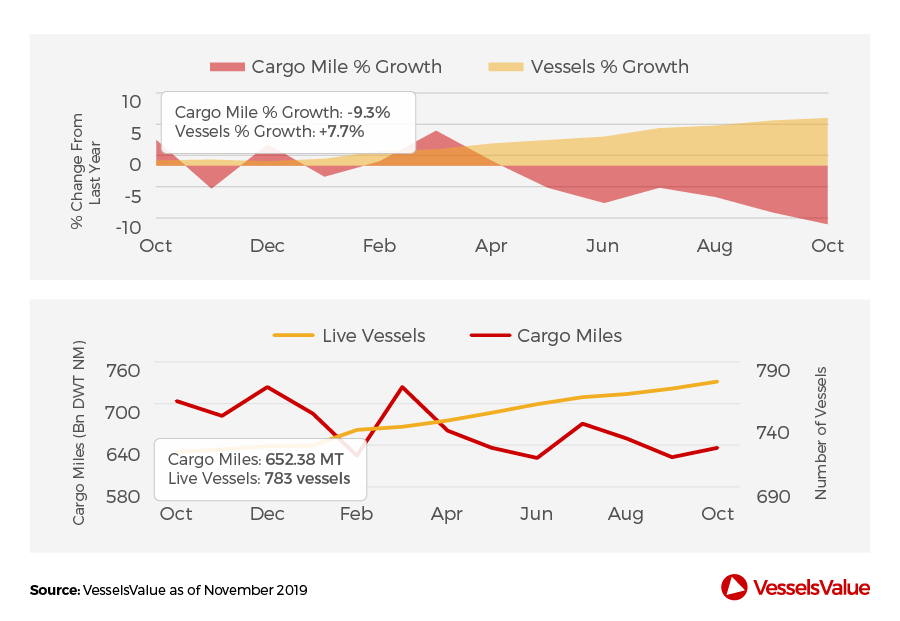
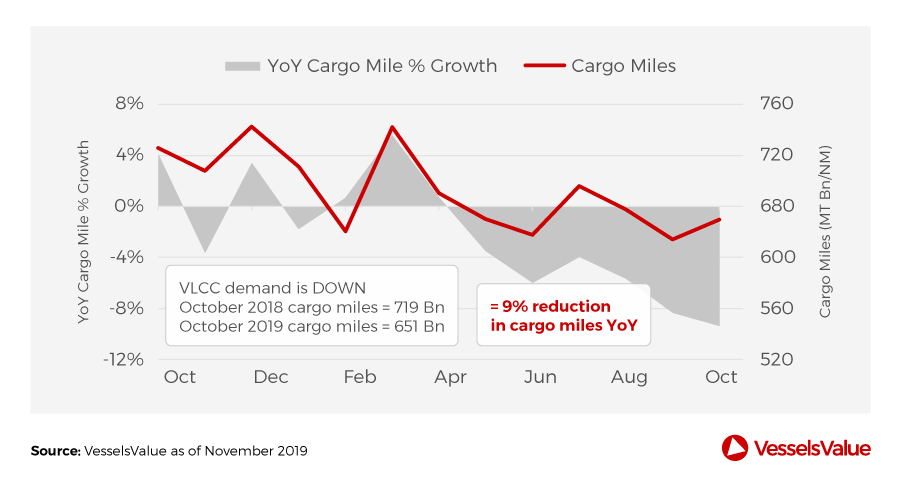
VLCC TCE rates ended October at around $50k. This is below the high reached in the middle of the month, but still represents a healthy return for owners. Interestingly, as shown in the charts below, ton mile demand is down circa 9% YoY, while the size of the fleet is has grown by 8%.
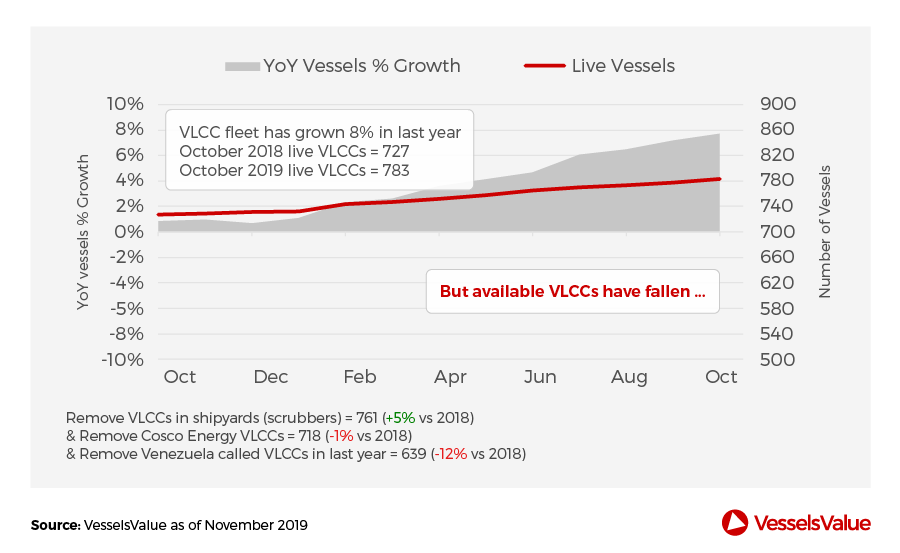
In normal circumstances, this excess of fleet growth over demand would result in falling rates and likely below breakeven earnings, but we are not in normal times. Political unrest (Mid East, Venezuela), trade wars (US, China) and to some extent scrubber installations have led to a net YoY reduction on the number of available VLCCs by circa 12%.
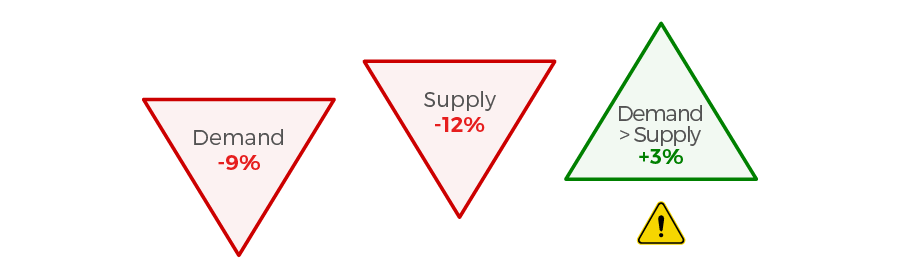
Therefore, VLCC demand has fallen 9%, but available vessels have fallen by 12% leading to the current high rate environment. However, this is a risky situation being driven by politics, not fundamental demand growth or structural lack of vessels.
VLCC Total Fleet vs Ton Mile Demand over Last Year
VLCC Available Fleet vs Ton Mile Demand
Disclaimer: The purpose of this blog is to provide general information and not to provide advice or guidance in relation to particular circumstances. Readers should not make decisions in reliance on any statement or opinion contained in this blog.
Want to know more about how our
data can help you assess the market?